Summary
When developing adeno-associated virus vectors as drug products, multiple quality attributes must be monitored to ensure a safe and efficacious final product. Three such QAs are total AAV particle concentration, aggregate content, and thermal stability. The DynaPro® NanoStar® and DynaPro Plate Reader enable fast, easy measurements of these quality attributes in batch mode with combined dynamic and static light scattering.
Introduction
Adeno-associated virus (AAV) consists of a non-enveloped protein capsid with diameter ~25 nm, packed with single-stranded DNA. With a history of over fifty years of study, AAV has become one of the most popular and well-characterized gene-delivery vectors for clinical applications.1,2
To provide safe and effective gene-therapy products, several quality attributes (QAs) must be quantified throughout the development and manufacturing process. The most common quality attributes relate to stability, purity, and potency of the AAV product.3
A variety of analytical tools are used to monitor QAs of AAV vectors, including analytical ultracentrifugation (AUC) and real-time PCR. However, these techniques can be labor-intensive, costly, and destructive to the sample, making them unsuitable for early-stage, high-throughput screening. SEC-MALS is non-destructive, easier and faster than the aforementioned techniques. The use of SEC-MALS with a DAWN® multi-angle light scattering detector to characterize AAV QAs including size, aggregation, concentration and empty:full ratio is discussed in application note AN1617: AAV critical quality attribute analysis by SEC-MALS.
SEC-MALS provides detailed analysis, but requires 30 minutes per sample and may not be appropriate for screening of processes and formulations. In contrast, batch light-scattering techniques provide quick, easy, and high-throughput characterization of AAV solutions, albeit with limited resolution and accuracy in comparison. Here, batch static and dynamic light scattering (SLS and DLS) are used to quantify three AAV quality attributes:
- Aggregate content
- Thermal stability
- Total viral particle concentration
This application note highlights all three measurements in both the DynaPro Plate Reader and DynaPro NanoStar DLS/SLS instruments.
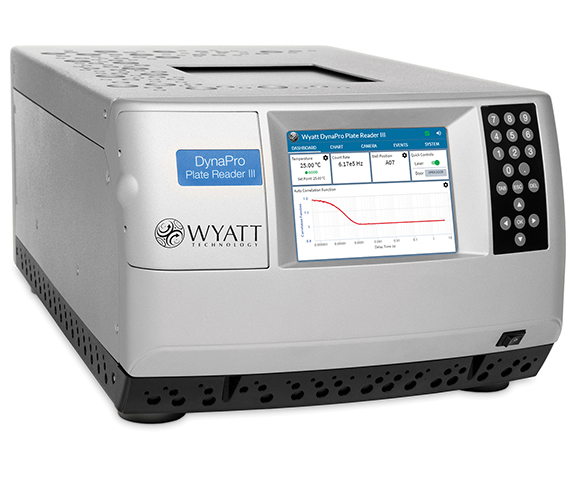
DynaPro Plate Reader performs dynamic and static light scattering measurements in standard 96, 384 or 1536 well plates.
Materials and Methods
AAV9 samples (Table 1) were kindly provided by Virovek, Inc. (https://www.virovek.com/), which specializes in large-scale AAV production. Samples S1 and S2 represented purified AAV samples that are either ‘empty’ (no DNA payload) or ‘full’ (containing full-length, single-stranded DNA). Sample S3 is an AAV with an unknown amount of DNA payload. Samples S4 through S7 represent investigations of various buffer conditions on the stability and aggregate content of the AAVs.
Batch DLS and SLS measurements were performed with the DynaPro NanoStar and DynaPro Plate Reader as described below. Data acquisition and analysis were performed with DYNAMICS® software.
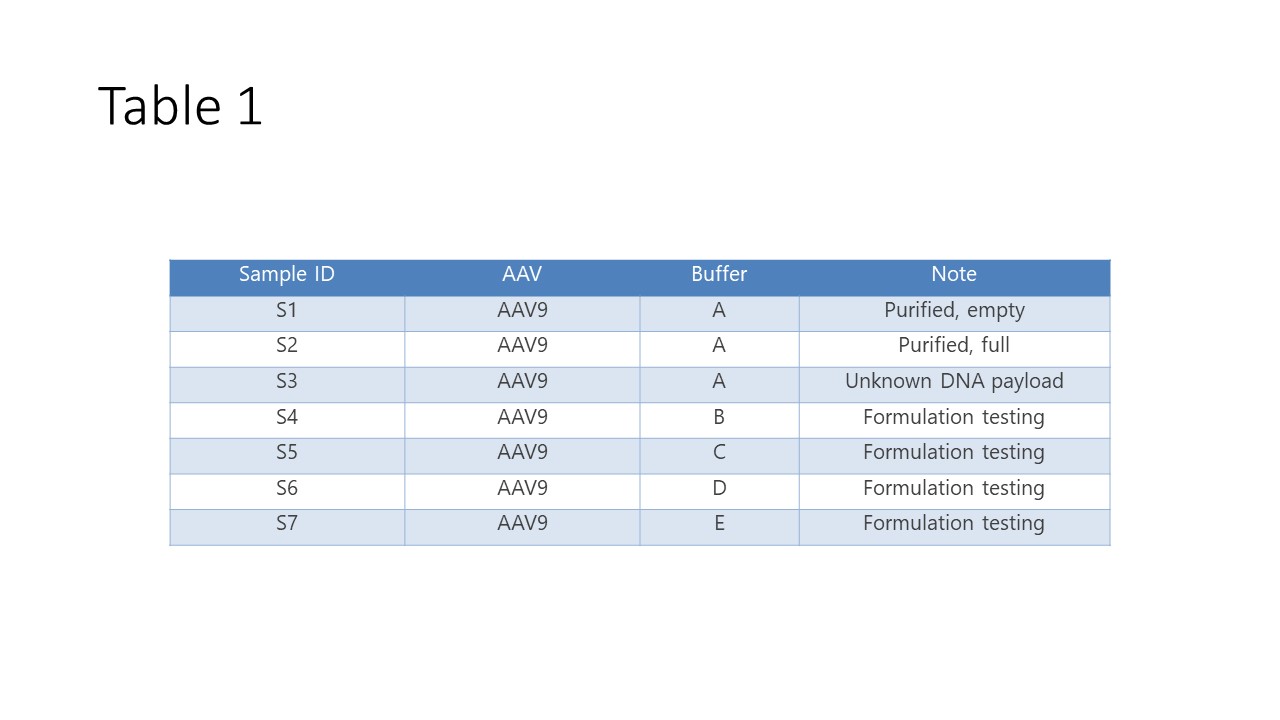
Table 1: AAV sample description
DynaPro NanoStar
Low-volume DLS and SLS measurements were performed with a DynaPro NanoStar to assess the size and size distribution for aggregation. For samples S1 through S3, 1.25 µL of neat AAV solutions were loaded into the quartz cuvette. Each measurement consisted of five 5-second acquisitions. DLS and SLS data were collected to determine hydrodynamic radius (Rh), aggregate content, molar mass, and viral particle concentration.
DynaPro Plate Reader
High-throughput measurements were made using the DynaPro Plate Reader. All measurements were performed in a 384-well microtiter plate (Aurora), and each well was loaded with 30 µL solution. The plate was centrifuged at 400 g for 1 minute prior to loading into the plate reader.
AAV samples S1 and S2 were diluted 1:10 in buffer. In addition, three mixtures of S1 and S2 were created with ratios of full:empty AAV corresponding to 1:1, 1:10, and 1:50 (v/v). Each AAV solution was loaded into the microtiter plate in triplicate, and each well was capped with 1-2 drops of silicone oil to prevent evaporation. DLS and SLS data were collected to determine Rh, aggregate content, and viral particle concentration at 25 °C. For thermal stability measurements, the temperature was ramped continuously from 25 °C to 85 °C at a rate of 0.1 °C/min, and Rh was measured throughout the temperature ramp.
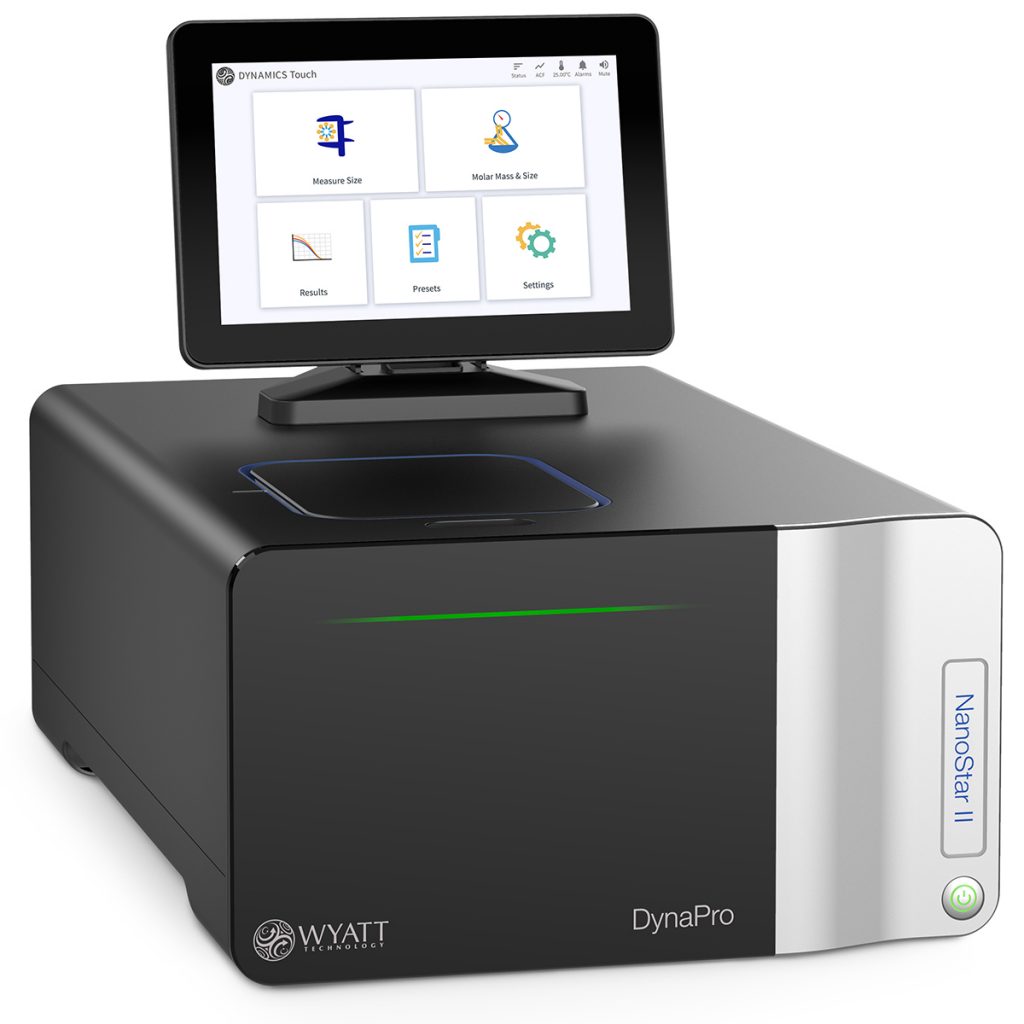
DynaPro NanoStar performs dynamic and static light scattering measurements in 1.25 µL quartz or 4 µL disposable cuvettes.
AAV samples S4 through S7 were loaded into single wells without dilution. The wells were sealed with tape (Nunc) to prevent evaporation. The plate was incubated at 37 °C for two hours, and the Rh distribution was measured over time to determine the effect of the formulation buffer.
Results and Discussion
Size and size distribution
Measuring the size and size distribution with batch DLS provides a quick approach to assessing the degree of aggregation in AAV solutions. Among the seven AAV samples tested, DLS revealed clear differences in particle size and aggregate content. Purified AAVs (S1 and S2), exhibited autocorrelation functions (ACF) with smooth, fast decays, characteristic of monodisperse samples of the expected size (Figure 1, left). In contrast, the autocorrelation functions for samples S4 through S7 decayed more slowly, indicative of larger aggregates present in the solution. Fitting the ACFs with a regularization algorithm provides the size distributions shown in the lower graph of Figure 1.
Purified AAV samples S1 and S2 appear to be uniform solutions with Rh = 14.7 ± 0.7 nm and 15.6 ± 0.1 nm, respectively. Furthermore, the weight-average molar mass (Mw) determined by SLS with NanoStar are 3.67 ± 0.01 MDa for S1 and 6.78 ± 0.03 MDa for S2. The molar mass of S1 agrees well with the capsid molar mass measured by SEC-MALS.4
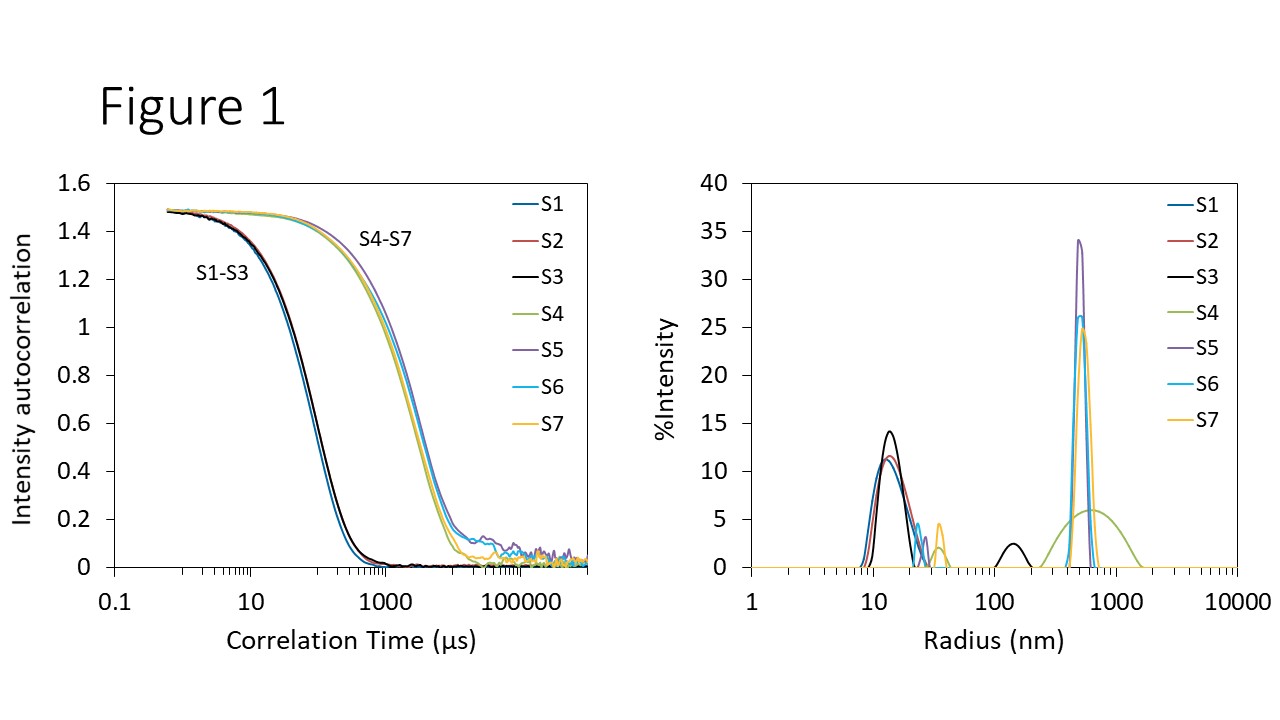
Figure 1. Autocorrelation functions (left) and size distribution via regularization (right) of AAVs for formulation screening.
The increase in molar mass in S2 is consistent with the incorporation of the DNA into the viral capsid; however, its apparent molar mass is slightly larger than the value of 4.93 ± 0.03 MDa determined by SEC-MALS.4 This discrepancy in molar masses determined by (unfractionated) DLS/SLS and (fractionated) SEC-MALS is likely due to the nature of two methods. SEC-MALS separates aggregates from the monomer, and hence reports the molar mass of the monomer separately from oligomers. However, a batch DLS/SLS measurement reports the weight-averaged molar mass of the entire solution including monomer, dimer and higher-molecule-weight species.
Although the autocorrelation function for Sample S3 is only subtly different from samples S1 and S2 (Figure 1, left), the resulting distributions show that Sample S3 contains two size modes (Figure 1, right). The smaller mode, at ~ 15 nm, overlaps well with purified AAVs S1 and S2, and is consistent with monomeric AAV or a mixture of monomer and small quantities of oligomers. The second mode contains large aggregates with Rh ~100 nm.
Samples S4 through S7 appear to be highly aggregated (Figure 1). One size mode with average Rh ~ 30 nm corresponds to oligomers, and a second, with Rh ~ 550 nm, is due to large aggregates. The 30 nm mode appears quite small in terms of %Intensity but actually is dominant when viewed in the %Mass representation. These buffer conditions were thought to mitigate or promote different aggregate content. However, in this study those differences were not apparent at 25 °C, and were only noticeable upon incubation at 37 °C (see below).
Thermal stability
Two tests of thermal stability were performed in this study. First, the hydrodynamic radii of samples S1, S2, and their mixtures were measured throughout a continuous temperature ramp to quantify aggregation onset temperature Tonset. In addition, S4 through S7 were incubated at a constant temperature of 37 °C to observe changes in size and size distribution occurring at physiological temperature.
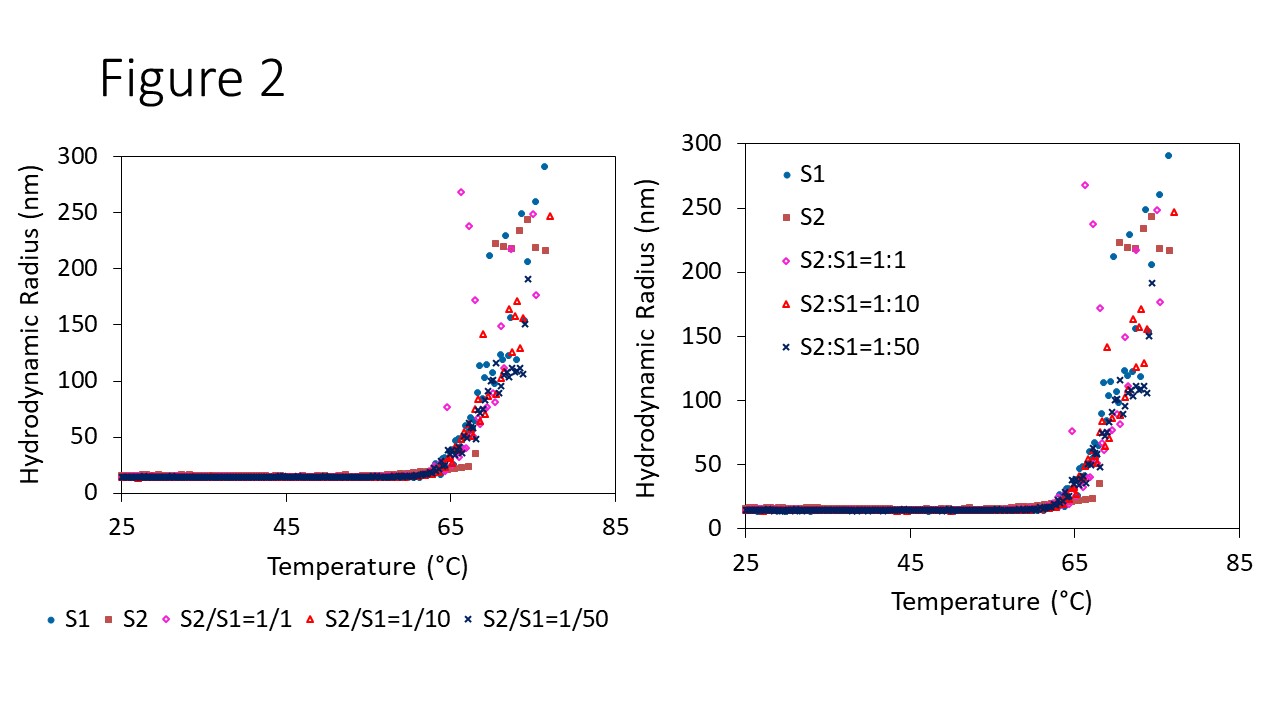
Figure 2. Aggregation screening of AAVs upon thermal ramping.
Both full and empty AAVs appeared to have the same Tonset, suggesting incorporation of the DNA payload does not change the thermal stability of the capsid. Figure 2 shows Rh as a function of temperature for empty AAV (S1), full AAV (S2), and three different mixtures. The size remains constant for all the samples until the temperature is increased beyond 60 °C. A sharp increase in Rh was then observed, growing from 14 nm to 300 nm, indicating the formation of aggregates. Onset analysis in DYNAMICS was used to determine Tonset and the corresponding radius for each sample. The onset temperature was the same across all samples at 62.5 ± 0.5 °C, and its corresponding onset Rh was 18.3 ± 1.1 nm.
The response of aggregated AAV samples (S4 through S7) to physiological thermal conditions was examined at a fixed incubation temperature of 37 °C. As shown in Figure 3, all four AAV solutions exhibit a decrease in Rh as a function of incubation time. At t = 0, the mean size of all four samples ranged from 450 nm to 530 nm, with S5 being the largest and S4 being the smallest. The rate of aggregate dissolution varied as a consequence of the different formulation additives, resulting in final mean sizes of 140 nm to 400 nm.
Rh decreased the most for S6, which was formulated with the highest concentration of a particular buffer ingredient. It was hypothesized that this component could prevent aggregation of AAVs, and may also enable recovery of monomers from aggregated samples.
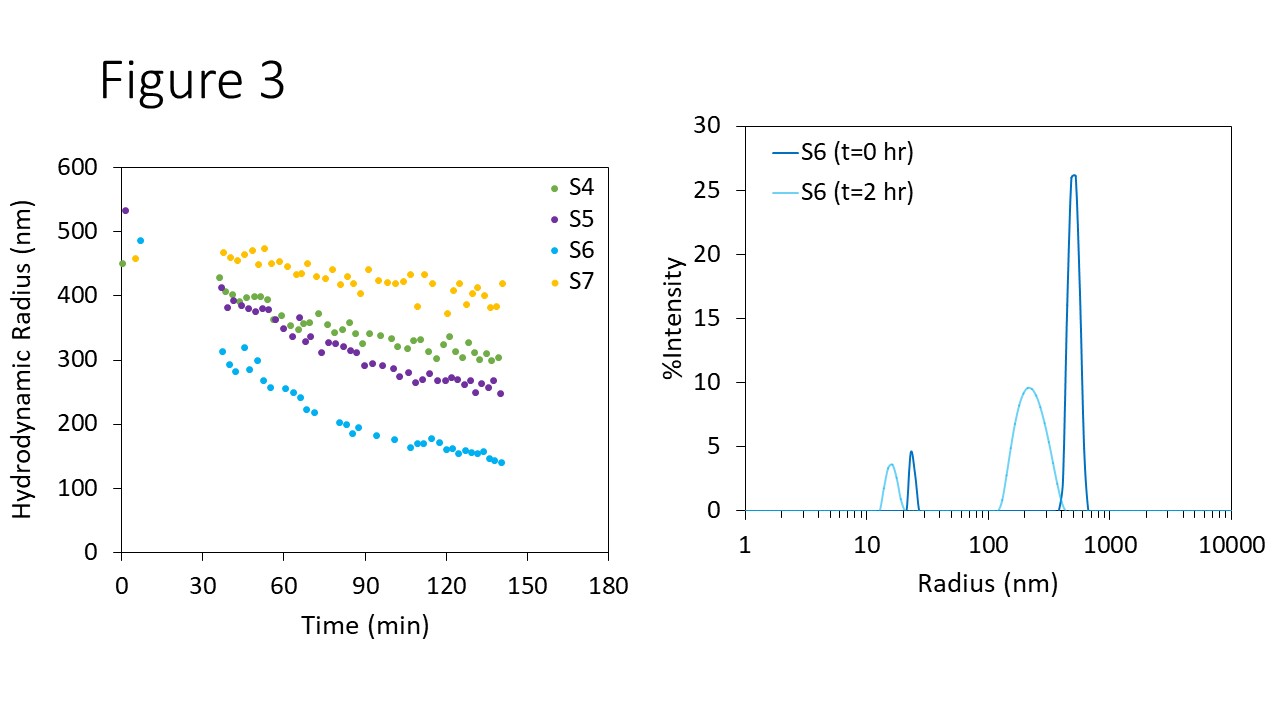
Figure 3. Left: Rh versus time upon incubation at 37 °C for AAVs in different formulations. Right: An example of evolving size distribution during incubation, sampled at t = 0 and t=2 hours.
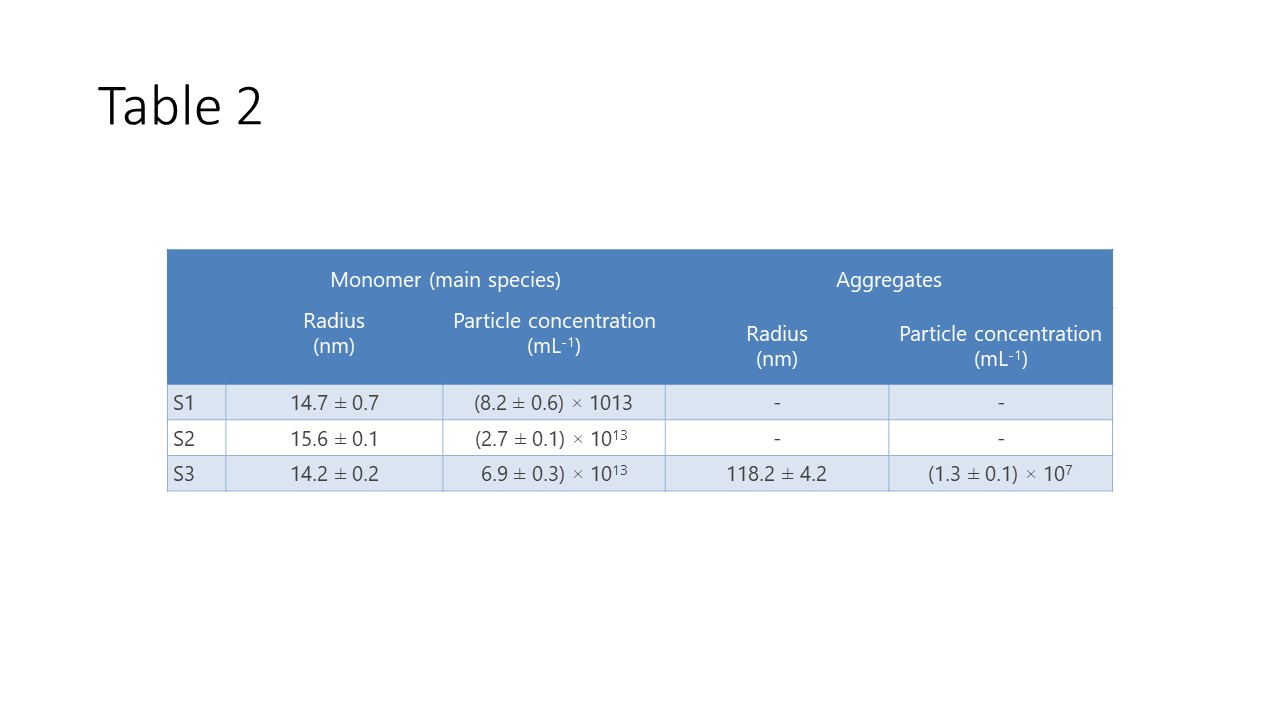
Table 2. Size distribution and particle concentration by regularization in DYNAMICS for Sample S1, S2 and S3.
Particle concentration
Batch SLS and DLS measurements with the NanoStar and Plate Reader enable rapid quantitation of the particle concentration for both monomodal and multimodal systems. Determining particle concentration requires knowledge of the particle shape—in this case a sphere. In addition, the refractive index (RI) of the particles and buffer must be specified. DYNAMICS comes pre-loaded with a library of RI values for common materials, and when these are not appropriate, users may specify custom RI values for complex materials like AAVs. RI values of 1.43 and 1.48 were assigned to S1 and S2, respectively, based on protein and nucleic acid content and empirically validated. With these inputs, the Rh measured by DLS and the static light scattering intensity are used together to provide particle concentration. For typical AAV samples, the concentration measurable by this technique ranges from ~6×10¹⁰ mL-1 to ~1×10¹⁵ mL-1.
Figure 4 compares the particle concentrations for S1 and S2, obtained with NanoStar and DynaPro Plate Reader, to values determined by the SEC-MALS AAV method described in AN1617. These samples had previously been quantified by SEC-MALS to determine the molar mass, dimer and aggregate content, and the concentration of each species.4 The SEC-MALS method utilizes a well-validated analysis which is highly accurate and orthogonal to the DLS/SLS method. DYNAMICS reports concentrations of (8.2 ± 0.6) × 1013 mL-1 for S1 and (2.7 ± 0.1) × 1013 mL-1 for S2, respectively. Both NanoStar and DynaPro Plate Reader determined comparable result, within 22% of the SEC-MALS values. This excellent level of agreement means that batch measurements can be used to quickly screen AAVs for capsid concentration.
DYNAMICS can also determine the particle concentrations of multimodal samples, such as sample S3, as shown in Table 2. The monomer concentration of S3 is (6.9 ± 0.1) × 1013 mL-1 and the concentration of larger aggregates was measured as (1.3 ± 0.1) × 107 mL-1. Since the degree of DNA loading was unknown, the average RI value of empty and full AAVs was used –1.46.
Three main limitations are encountered for batch concentration measurements by DLS/SLS relative to separation-based techniques such as SEC-MALS or FFF-MALS (FFF is appropriate for particles that are too large for SEC):
- Oligomers: In DLS/SLS the measured Rh value is approximately the z-average of all species present, while the scattered intensity is their weight average. Thus the presence of oligomers leads to underestimation of the concentration. In most cases the accuracy is much better than an order of magnitude.
- Size limit: the upper limit of Rh for concentration measurement is 165 nm for DynaPro Plate Reader and 175 nm for DynaPro NanoStar. This range covers AAVs and just about all viral and non-viral vectors.
- RI dependence: The choice of refractive index significantly impacts the calculation. RI values of 1.43 and 1.48 have been confirmed empirically for empty and full AAVs, respectively, and agree with more rigorous characterization by SEC-MALS.4 Where the DNA loading is unknown, an average RI of 1.46 may be applied, consistent with literature.5 However, if 1.46 is selected for the analysis, while the AAVs are in actuality all full and the true RI is 1.48, this error of 1.5% in refractive index leads to an error of 33% in concentration. For screening purposes this discrepancy is
usually considered acceptable. Notably, the effect on absolute accuracy does not impact linearity of the analysis for samples with identical composition.
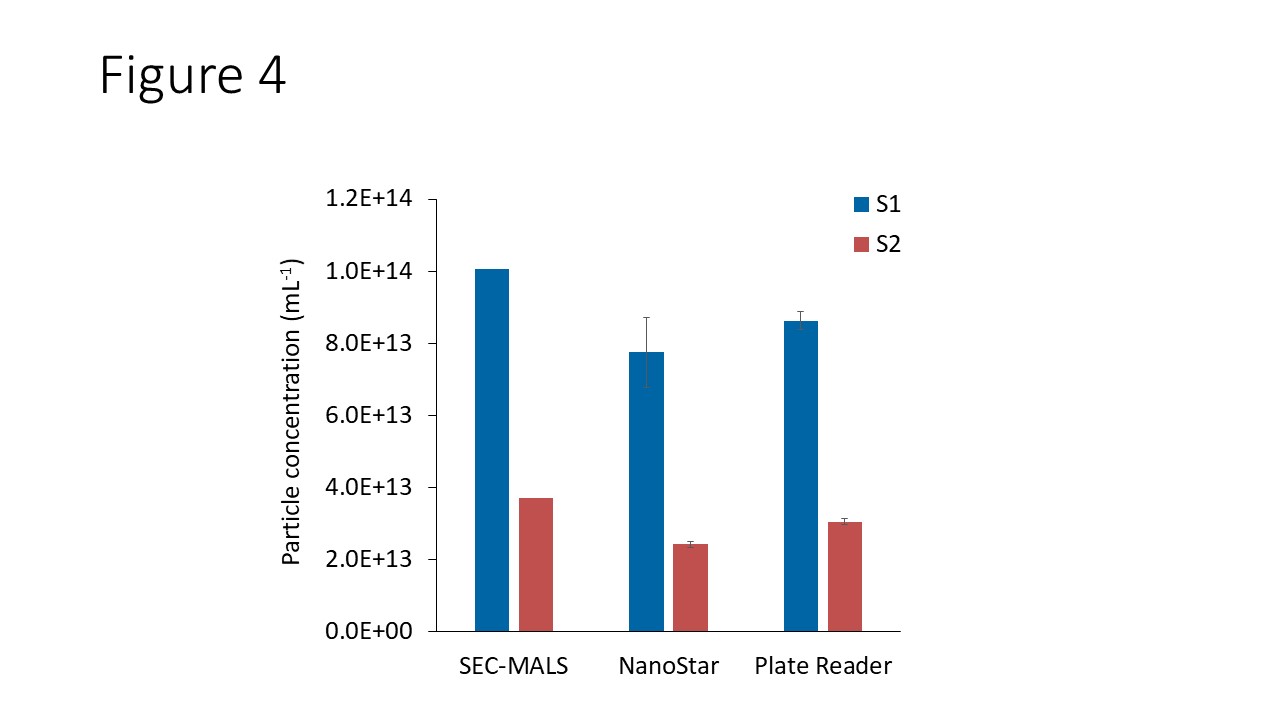
Figure 4. Comparison of viral particle concentration determined in DYNAMICS with those determined by ASTRA’s AAV method.
Conclusions
The DynaPro NanoStar and DynaPro Plate Reader offer rapid, low-volume screening of AAV quality attributes via batch static and dynamic light scattering. Both instruments characterize particle size and size distribution, thermal and colloidal stability, and total capsid concentration. These methods are non-destructive and require no method development, making them ideal for incorporation into multiple areas of AAV drug development, process development and quality control.
For more information about how to implement AAV characterization methods, see the AAV Services page. Click the button below to request information on the NanoStar and DynaPro Plate Reader instruments.
Acknowledgments
We thank Virovek Inc. for kindly supplying the AAV samples used in this study.
References
1. Hastie, E. & Samulski, R. J. Adeno-Associated Virus at 50: A Golden Anniversary of Discovery, Research, and Gene Therapy Success—A Personal Perspective. Hum. Gene Ther. 26, 257–265 (2015).
2. Naso, M. F., Tomkowicz, B., Perry, W. L. & Strohl, W. R. Adeno-Associated Virus (AAV) as a Vector for Gene Therapy. BioDrugs 31, 317–334 (2017).
3. Wright, J. F. Manufacturing and characterizing AAV-based vectors for use in clinical studies. Gene Ther. 15, 840–848 (2008).
4. Chen, M. & Purchel, A. Quantifying quality attributes of AAV gene therapy vectors by SEC-UV-MALS-dRI. (2019). Available at: https://www.wyatt.com/library/application-notes/an1617-aav-critical-quality-attribute-analysis-by-sec-mals.html
5. Steppert, P. et al. Quantification and characterization of virus-like particles by size-exclusion chromatography and nanoparticle tracking analysis. J. Chromatogr. A 1487, 89–99 (2017).