Characterization of nano-pharmaceuticals with field-flow fractionation and light scattering (FFF-MALS-DLS)
Introduction
One of the primary challenges in developing effective formulations for the nanoscale delivery of therapeutics is particle characterization. Standard techniques such as dynamic light scattering (DLS), particle tracking analysis (PTA) and transmission electron microscopy (TEM) typically suffer from tradeoffs between simplicity, detail and sampling efficiency. For example, DLS is simple to use, and can sample a large particle ensemble, but only provides semi-quantitative, low-resolution size distributions; on the other hand, TEM offers exquisite structural detail, at the cost of complexity, laborious sample preparation and very small ensembles that lead to high statistical uncertainty.
Field-flow fractionation (FFF) is a size-based separation technique covering the entire range of macromolecules and nanoparticles from 1 - 1000 nm in diameter. Coupling FFF to online multi-angle light scattering (MALS) and DLS detectors provides detailed, quantitative size distributions and structural information, sampled over large ensembles, for good statistical robustness. Spectroscopic and other types of online detectors may be added to obtain compositional information and more. Since FFF systems incorporate standard chromatography modules, the measurements are fully automated, and fractions may be isolated and collected for additional off-line analysis. It is a unique property of FFF that very little sample preparation is needed, because the separation method itself eliminates most impurities, and inherently performs dialysis into the carrier fluid.
These capabilities of FFF-MALS-DLS provide a pathway to meeting the requirements of regulatory agencies for enhanced characterization of liposomal drug formulations and other nanoparticle delivery systems 1–4 and have led to the development of international standards literature for nanoparticle characterization such as ISO TS 21362 and ASTM WK 68060, as well as methods published by the NCI-NCL and EU-NCL5,6.
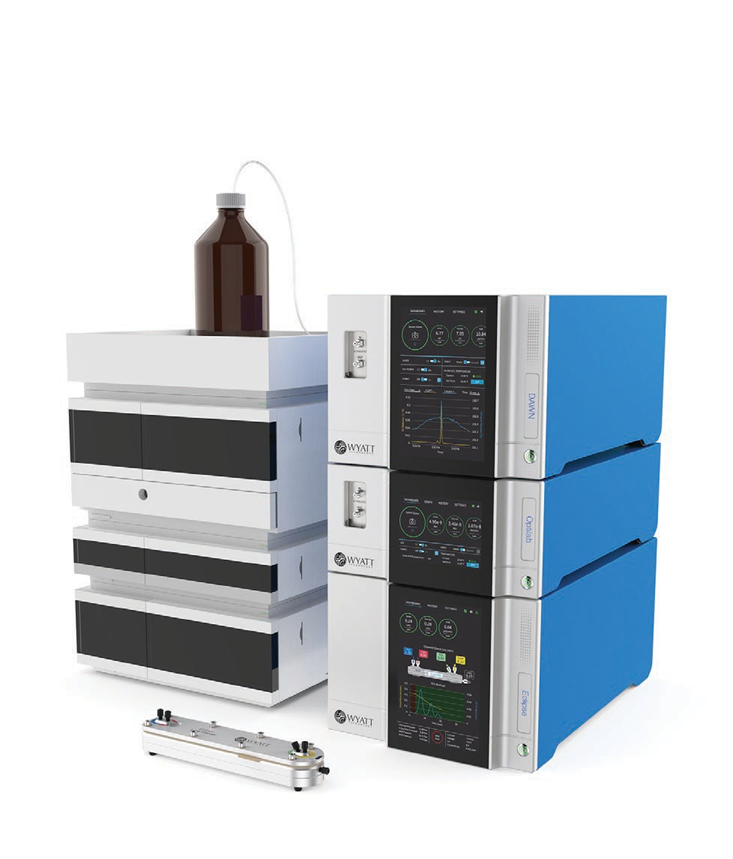
The system described here is implemented in Wyatt Technology’s FFF-MALS-DLS platform comprising an Eclipse(TM) FFF flow controller and separation channel, DAWN(R) MALS instrument, WyattQELS(TM) DLS module, Optilab(R) differential refractometer and standard HPLC components, illustrated in Figure 1. For particles above 30 nm in radius, a wide-bore flow cell is installed in the MALS detector in order to provide the most accurate online DLS measurements. The entire setup is controlled by the VISION(TM) software suite.
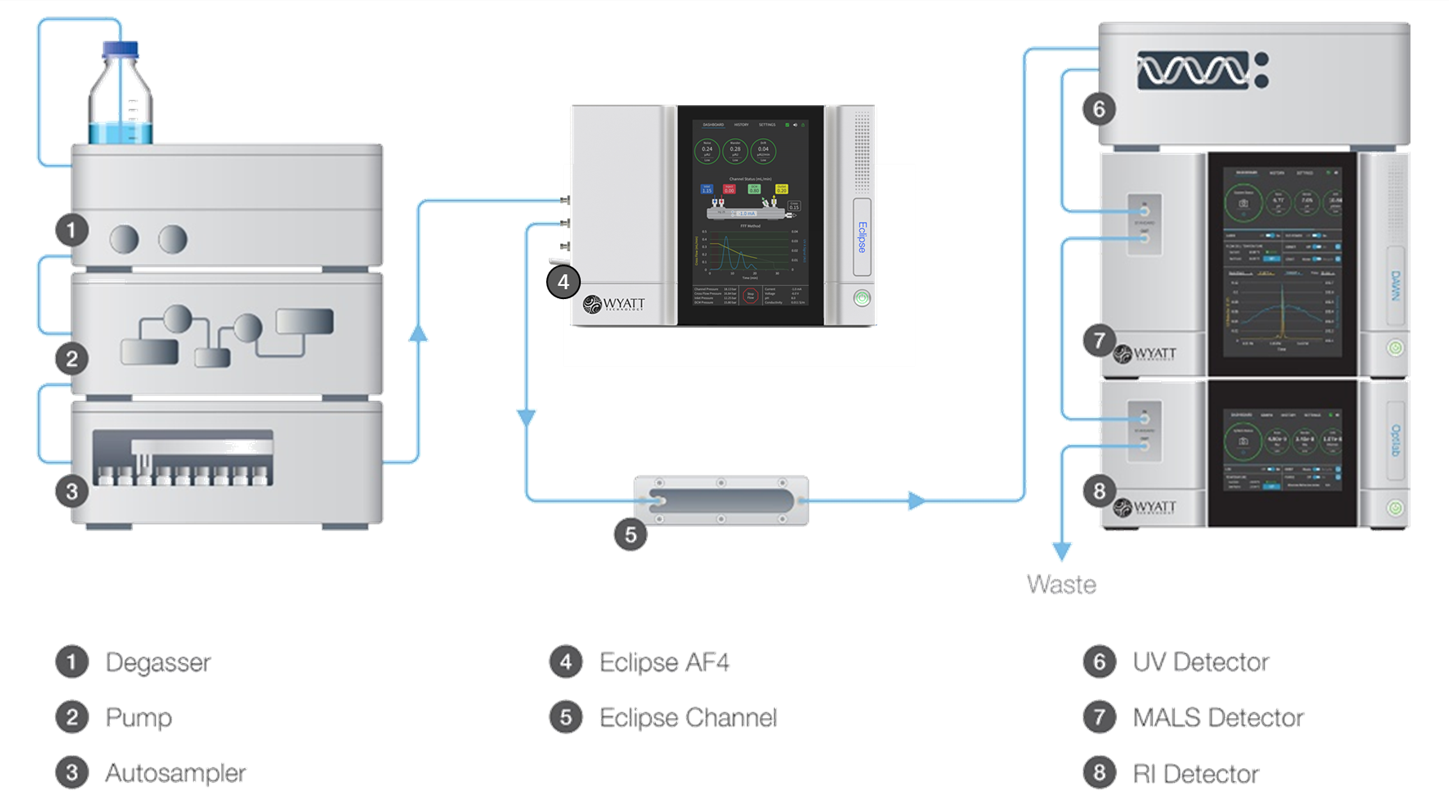
Figure 1. FFF-MALS-DLS system components and organization. The DLS detector is embedded in the MALS detector.
Nanoparticle separation with FFF
Field-flow fractionation was invented by Calvin Giddings in 1966 7. However, it took several decades until commercial FFF instrumentation became convenient, robust and popular in analytical laboratories, primarily in the asymmetrical-flow FFF (FFF) format described herein. The advent of nanoparticle-based drug and gene delivery formats has increased the demand for its unique capabilities.
The flow FFF principle, described in Figure 1, was described by Giddings in a review article 8. Briefly, separation takes place in an open channel consisting of two long, narrow blocks bolted together with a spacer in between. The spacer is a polymer foil with a typical thickness of just 200 to 500 µm. Flow within this thin ribbon-like channel is laminar, with a pronounced parabolic flow profile that drives particle separations.
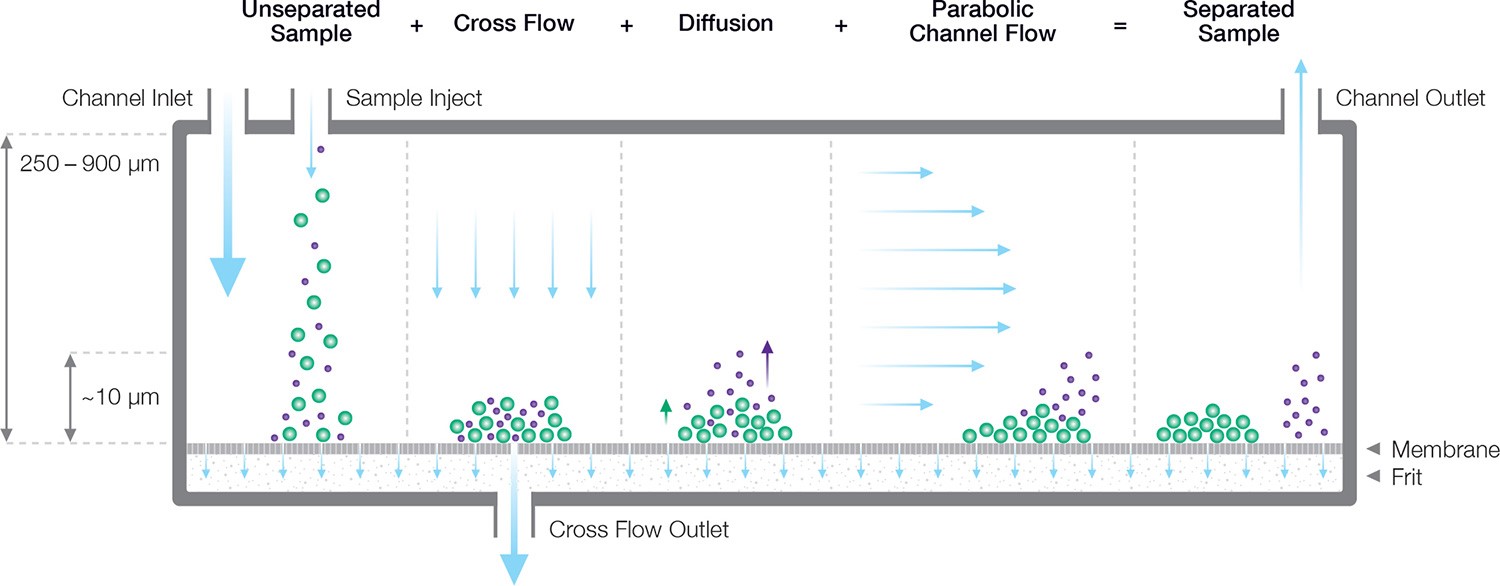
Figure 2. Separation mechanism in an FFF channel, consisting of a semi-permeable membrane and a controllable lateral flow restrictor which forces some of the solvent to flow through the membrane. The size-dependent balance between diffusion and cross flow leads to different height distributions for different sizes. Smaller particles are swept out of the channel earlier than larger particles, which remain close to the membrane and experience a lower flow velocity.
The bottom block comprises a semi-permeable membrane supported by a frit. The membrane is permeable to solvent but not to the analyte; this essential function is guaranteed by selecting the appropriate membrane pore size, expressed as a molecular-weight cutoff (MWCO) ranging from 1 kDa to 100 kDa. The particle-containing carrier fluid flows parallel to the membrane, but a constriction at the end of the channel forces some of the fluid to pass through the membrane, creating a “cross-flow field” that concentrates the particles towards the membrane. Diffusion acts as a counterforce that drives particles back up into the channel, resulting in a height distribution above the membrane that depends on the particle’s translational diffusion coefficient Dt, and hence hydrodynamic radius Rh, as well as the cross-flow velocity9. Separation arises from differential transport velocity in the laminar flow profile according to the particles’ height above the membrane.
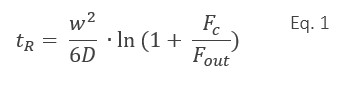
In FFF, the particle retention time tR depends on Dt, the channel thickness w, the cross-flow rate Fc (which is controlled by a precise flow controller), and the detector flow rate Fout. If the flow rates are constant over time and retention is sufficiently high, the retention time is, in good approximation, given by Eq. 19:
Retention time, zone broadening and dilution of the sample at the channel outlet for more complex flow profiles can be calculated by standard fluid dynamics 10. Computer simulation of the separation process enables virtual optimization of the separation method, as well as calculation of diffusion coefficients based on the measured retention time 11. An example of the excellent separation capabilities of FFF is shown in Figure 3.
FFF separation channels include analytical and semi-preparative scales. The latest development in FFF is the incorporation of an electrical field, applied perpendicular to the membrane. Charged particles exhibit a shift in height above the membrane, and a corresponding shift in retention time, that varies with applied field strength, from which the electrophoretic mobility µE and zeta potential may be calculated. This method can reliably determine µE for several components simultaneously, providing an indication of the charge distribution 12.
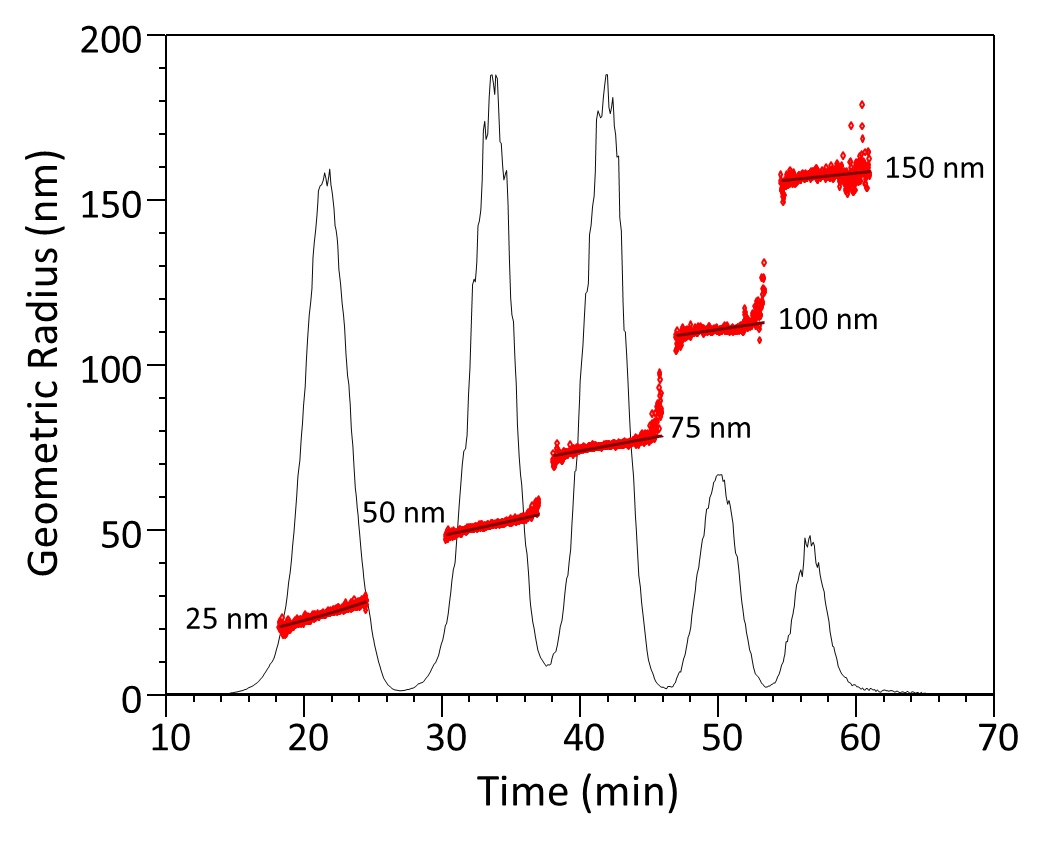
Figure 3. FFF separation of a series of latex standards ranging from 25 nm to 150 nm in radius. The size of each eluting fraction, determined online by MALS, is indicated by red symbols.
Online nanoparticle analysis
Separation of nanoparticles is just the first stage in their characterization. The ability to perform a variety of online measurements on the purified and nearly monodisperse fractions flowing through one or more detectors means that each species can be analyzed thoroughly for physical and compositional properties.
Multi-angle light scattering (MALS)
MALS measures the time-averaged intensity of light scattered by the nanoparticle ensemble into multiple scattering angles, defined relative to the direction of propagation of the incident laser beam. A MALS instrument typically incorporates between three and eighteen photodiodes to detect scattered light, though an eighteen-detector configuration is most common for nanoparticle applications. All the photodiodes are placed in a single plane, oriented perpendicularly to the polarization of the laser beam, as shown in Figure 4.
The application of MALS analysis to determine molar mass and size (rms radius, a.k.a. radius of gyration) is well known 13. The relationships between scattered intensity (reduced Rayleigh ratio, R), scattering angle q and analyte properties such as molar mass M, refractive index increment dn/dc, concentration c and rms radius Rg, are summarized in Equations 2 and 3, in the limit of dilute solutions. K is an optical constant related to the illumination wavelength l and refractive index of the carrier fluid n0.
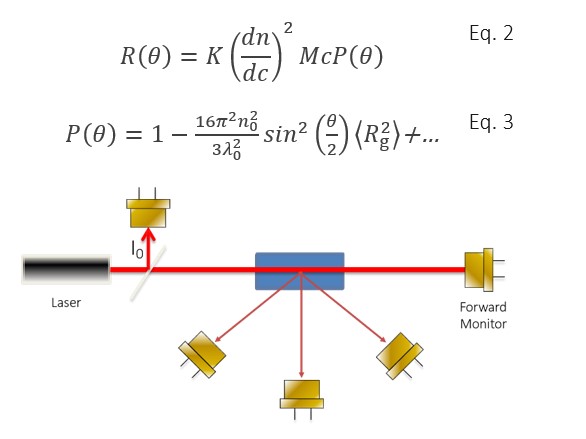
Figure 4. Basic multi-angle light scattering geometry. Detectors are placed at multiple angles relative to the illuminating beam, within the plane perpendicular to the light’s polarization vector. Additional detectors monitor the beam intensity and transmission through the flow cell.
In the limit of sub-wavelength sizes and assuming (np/n0 - 1)<< 1, a collection of N uniform particles of volume V and refractive index np, produces the excess Rayleigh ratio given by Eq. 4 14:
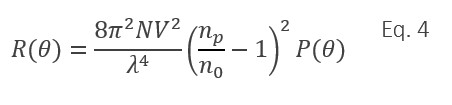
Analysis of P(q) yields the root-mean-square radius Rg, which is related to the particle’s overall structure and internal mass distribution. For specific, known particle shapes or conformations, Rg can be related to physical dimensions, e.g. the length of a narrow rod or the radius of a spherical shell, and hence the volume term V can be calculated 13. If V, np and n0 are known, the number of particles N in the scattering volume—and hence the particle concentration—may also be derived. This analysis has been demonstrated to be quite accurate in comparison with concentration determined by TEM, as seen in Figure 5 for influenza viruses 15.
Figure 5. Top: size and number density analysis of influenza virus by FFF-MALS, overlaid on LS chromatogram. Bottom: comparison of FFF-MALS size and integrated particle concentration with values determined by imaging (table data based on reference 15).
If the particles are large enough relative to λ then it may also be feasible to determine the general particle shape (spherical, ellipsoidal, etc) by fitting P(θ) to known angular functions that include additional terms in the expansion of Equation 3. This capability has been applied to characterization of thin-disk and cylindrical unilamellar liposomes 16. Explicit forms of the angular dependence of light scattering exist for several basic shapes including spheres, rods, ellipsoids and random coils13,14,17. This analysis has been applied to a carbon nanotube in Figure 6, demonstrating a distinct failure of the sphere model fit and success of the rod model. In order for the fits to be robust enough to estimate shape, at least one sample dimension should be an appreciable fraction of the wavelength, e.g. 100 nm if the MALS wavelength is 660 nm.
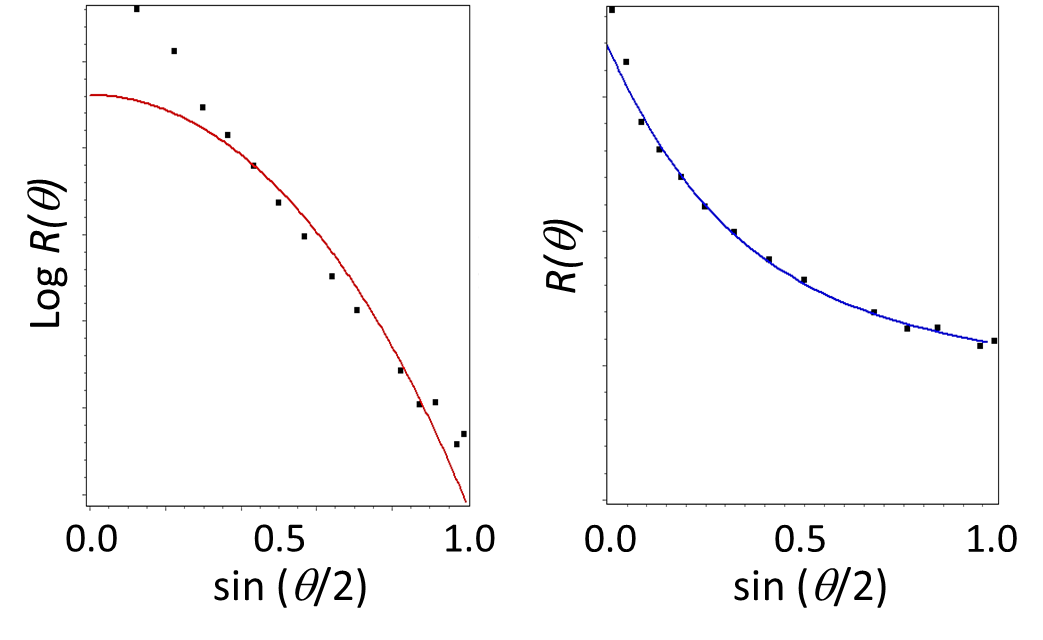
Figure 6. Estimating shape from the angular scattering function. The sample is a rod-shaped carbon nanotube. Left: the angular data are fit poorly by a sphere model. Right: the data are fit well by a rod model.
In addition to particle size and concentration, under dilute conditions typical of FFF the scattered intensity may also be related to the molar mass of a macromolecule flowing through the MALS detector (13) by Eq. 2. The concentration c is typically measured by an upstream or downstream detector based on UV/Vis extinction or differential refractive index. Hence the same MALS instrumentation can be used to characterize both nanoparticles and macromolecules in a complex sample, separated by FFF.
Wyatt Technology’s ASTRA(R) MALS analysis software provides calculations for molar mass as well as size and spherical particle concentration, and these may be determined at each eluting FFF fraction in order to obtain detailed size distributions. MALS is also commonly employed in-line with size-exclusion chromatography to characterize macromolecules such as proteins and polymers, providing absolute molar mass and size that do not depend on calibration of the retention volume with reference standards.
It is noteworthy that MALS measurements can take place on sub-second time scales, making this technology an
excellent candidate for process analytics of preparative and full-scale production processes. Using the
ultraDAWN(TM) real-time MALS detector for process monitoring and control, the average rms radius may be determined up to 30 times per minute to verify uniform nanoparticle production, identifying process deviations early on in order to minimize waste and discarded lots of precious material. Real-time MALS has also been demonstrated for monitoring molar mass and aggregate breakthrough in the purification of therapeutic monoclonal antibodies 18.
Dynamic light scattering (DLS)
Dynamic light scattering (DLS) is also known as photon-correlation spectroscopy (PCS) and quasi-elastic light
scattering (QELS). In DLS, rather than measuring the time-averaged intensity as a function of angle, size is determined by analyzing the rapid intensity fluctuations occurring on time scales of microseconds and milliseconds. These fluctuations arise through the Brownian motion of the particles: the wavelets scattered by individual particles combine coherently at the detector, and as the particles diffuse, the relative phases of the wavelets change and the detector experiences rapid intensity fluctuations.
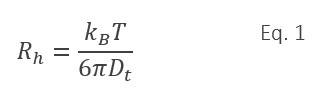
The rate of fluctuations is directly related to the particle’s translational diffusion coefficient Dt, which can in turn be converted via the Stokes-Einstein equation (Eq. 1) to a measure of size known as the Stokes radius or the hydrodynamic radius Rh.
For a spherical particle, Rh is the radius of the particle’s envelope, regardless of internal structure. For a non-spherical particle, Rh is the radius of a sphere with approximately the same overall volume as the particle; the more the particle’s shape deviates from spherical, the smaller the actual volume of the particle relative to the hydrodynamic volume Vh=4πRh3/3. For example, when the axial ratio of an ellipsoid is 3:1, the actual volume of the ellipsoid is roughly 30% smaller than the measured Vh , as estimated from material presented in Tanford’s classic textbook 19.
Standard DLS measurements are made on unfractionated samples (batch mode). While an average Rh is simple to determine, size distributions by this technique are subject to low resolution and ambiguity due to the complex, under-determined mathematical analysis involved. On the other hand, FFF fractionation of the sample by size prior to DLS measurement greatly simplifies and enhances size determination, since it can be assumed that each eluting fraction is practically monodisperse. Since FFF can separate particles that are quite close in size, FFF-DLS size distributions are robust and fully quantitative, providing far more detail than batch DLS. The qualitative distinction between size distributions of a liposome sample, measured by batch DLS and FFF-DLS as shown in Figure 7, are obvious.
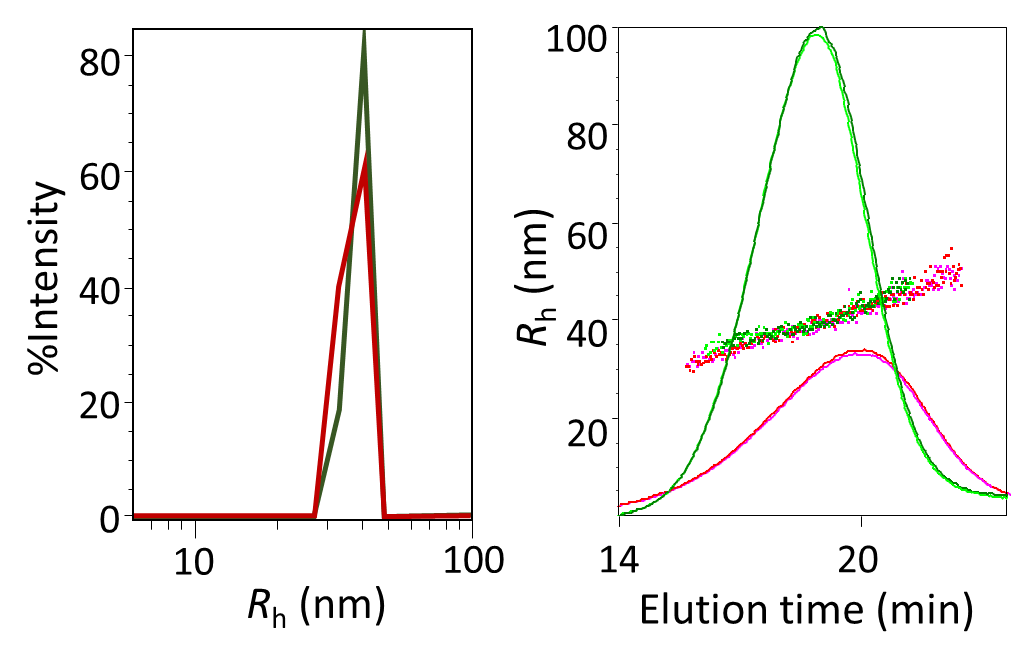
Figure 7. Comparison of liposome sizing by batch DLS and FFF-DLS. Left: batch DLS measurement of two liposome samples, empty and filled; Right: FFF-fractograms with overlaid DLS measurements of the two samples.
Multi-detection
The combination of MALS and DLS, with the addition of other online detectors, expands the range of analyses possible with a single FFF run. The most common and practical detection methods used with FFF for nanoDDS are described below.
Shape factor
The shape factor r is the ratio between Rg, determined by MALS, and Rh, determined by DLS. Its value has been
calculated for simple structures such as uniform spheres or ellipsoids, hollow spherical shells, rods, random coils and more. Several examples are provided in Table 1 for the shapes depicted in Figure 8.
Figure 8. Some simple structures for which shape factors have been calculated: uniform sphere, spherical shell, prolate ellipsoid and rod.
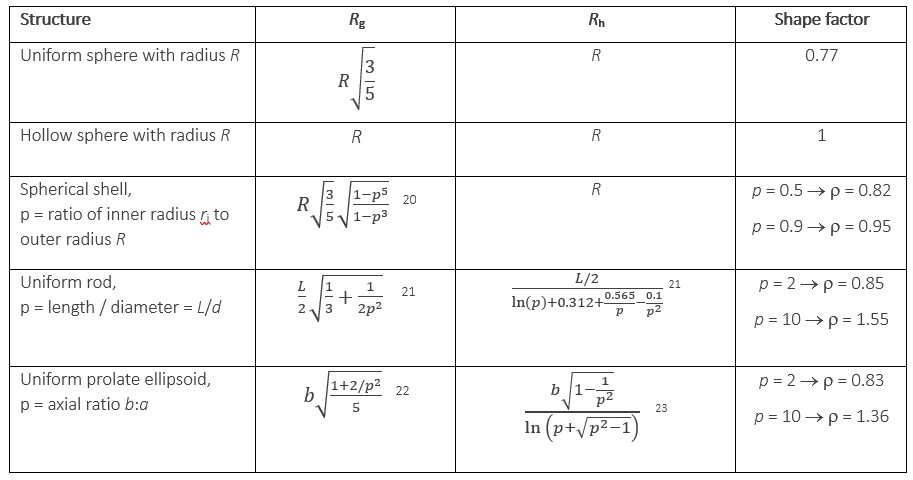
Table 1. Some representative shape factor values
In the context of nano-drug delivery, where a hollow delivery particle such as a liposome or VLP is expected to incorporate a drug or gene payload in the core, this structural parameter can differentiate between empty and full nanoparticles. Since the lipid bilayer of a liposome is typically about 4 - 5 nm thick, an empty liposome with a typical radius of 50 nm can be expected to have a r value of roughly 0.95. In fact a value of 0.93 was found by Vreeland et al for unilamellar liposomes 24.
Figure 9 illustrates the further analysis of empty liposomes and filled liposomes from Figure 7, measured by FFF-MALS-DLS. Since FFF separates according to hydrodynamic radius, it is not surprising that the samples exhibit the same Rh values (Figure 7b, as measured by online DLS) at each elution volume, even though the specific size distributions differ. On the other hand, the Rg values for each elution volume in the fractogram clearly differ (Figure 9 left), with filled liposomes presenting smaller Rg values relative to empty. The shape factors derived from the ratio of Rg:Rh (Figure 9 right) are, as expected, quite different.
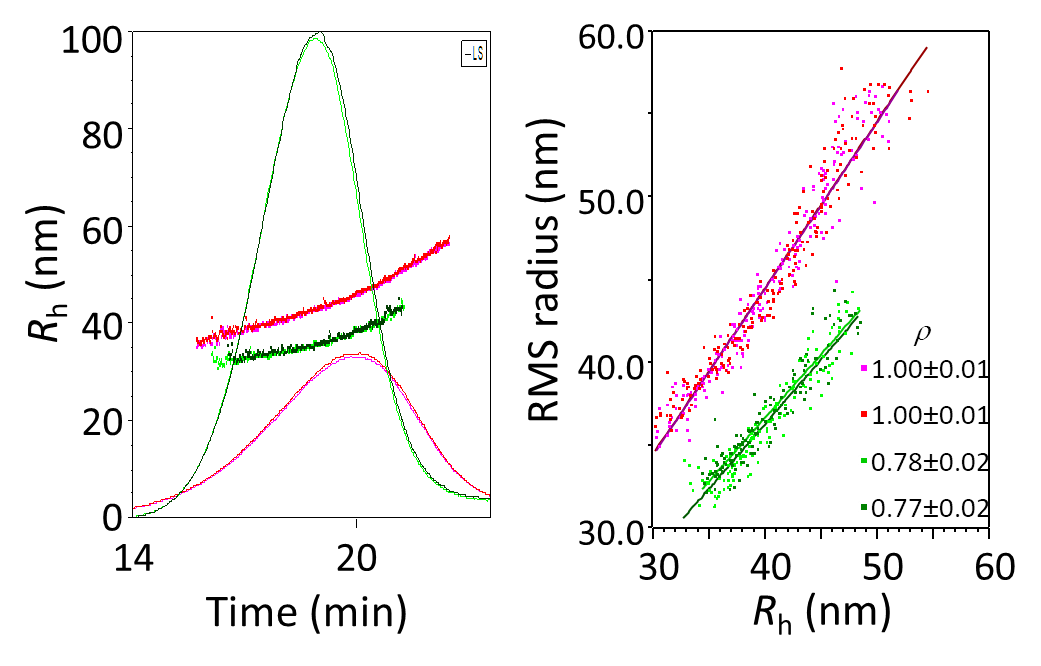
Figure 9. Empty and filled liposomes analyzed by FFF-MALS-DLS. a) fractograms overlaid with Rg values; b) shape factor analysis.
If a liposome is known to contain drug—for example by spectroscopic analysis—but still appears as a hollow sphere by shape factor, it can be inferred that the drug is incorporated into the lipid shell rather than the hydrophilic core.
Elongated objects are characterized by shape factors greater than ~ 1.1, as reflected in the FFF-MALS-DLS analysis of two heterogeneous particles, one spherical and one rod-like, shown in Figure 10.
UV and Fluorescence
Standard HPLC UV and fluorescence detectors may be added in-line with FFF. They may be used in several ways:
- To determine concentration of a sample containing an appropriate chromophore or fluorophore
- To determine full or partial sample composition via the absorbance or emission spectrum.
- To determine sample composition by combining the UV or fluorescence data with other signals, e.g. with refractive index data in the ‘conjugate analysis’ below.
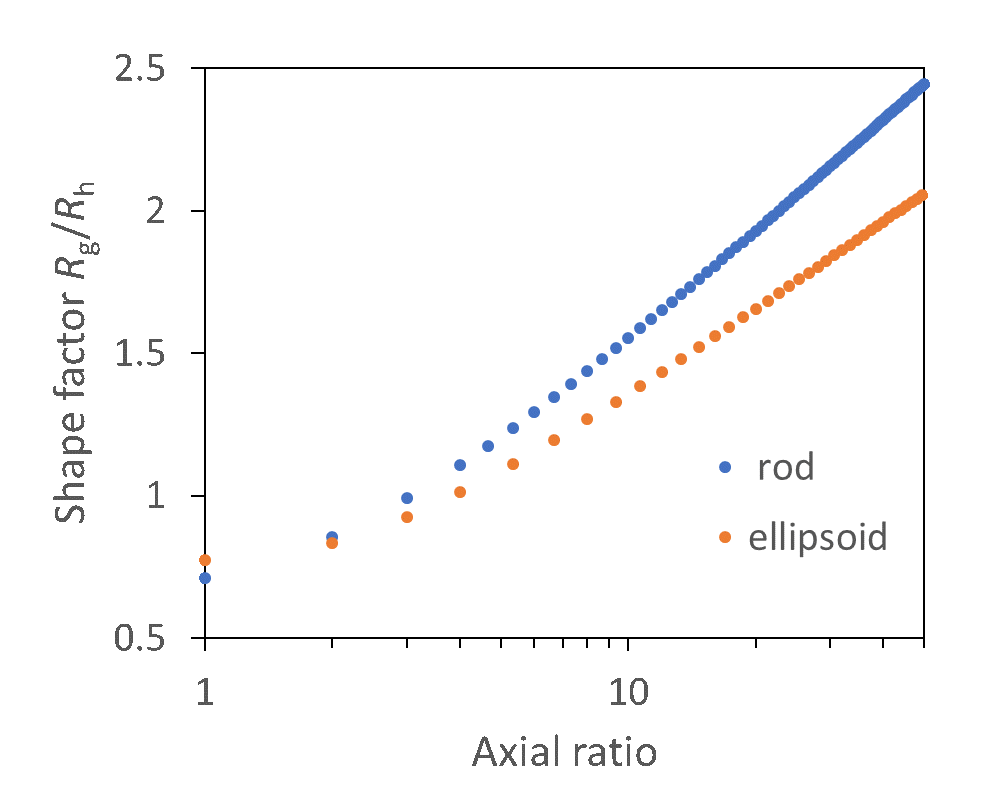
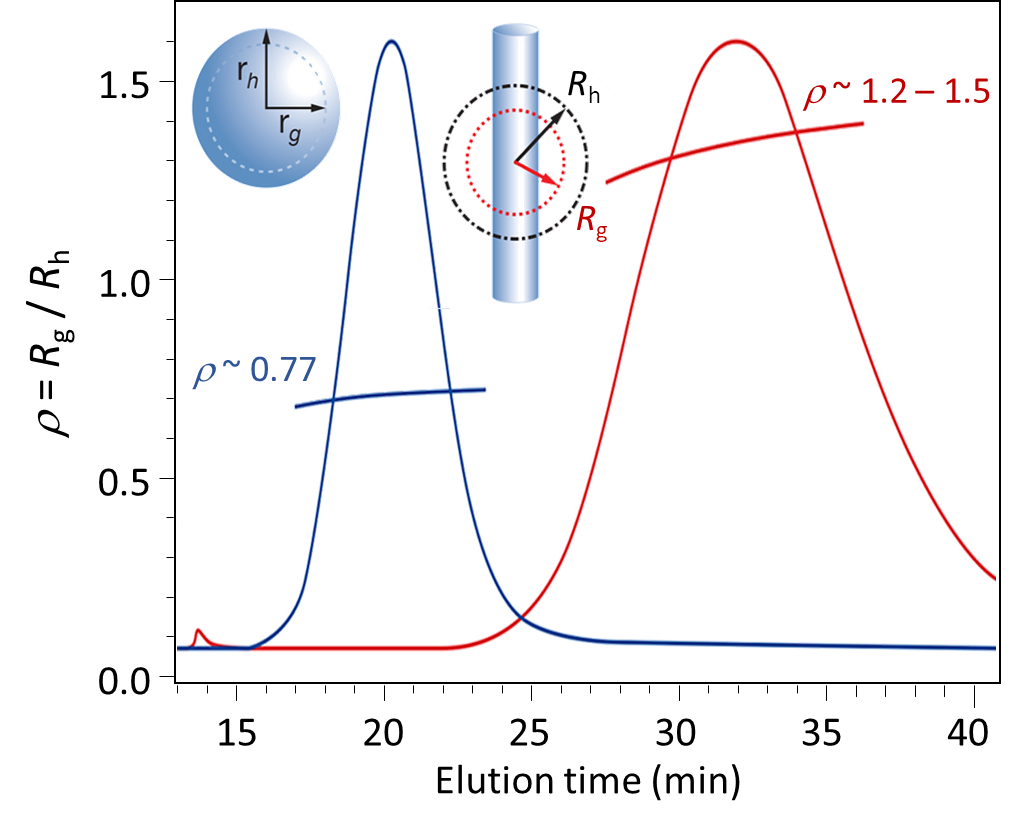
Figure 10. Shape factor analysis of uniform spheres and elongated particles. Top: theoretical shape factor values for rods and ellipsoids with given axial ratio (rods: length to diameter; ellipsoid: major to minor axes), based on Table 1. Bottom: FFF-MALS-DLS analysis of two types of particles constituting uniform spheres and rod-like particles, indicating ratios of length:diameter in the range of 5:1 to 10:1.
Conjugate analysis
The combination of two concentration detectors responsive to different sample properties—for example, a UV detector and an RI detector—can be combined with MALS to determine not only the overall molar mass but the molar mass of each component in the conjugated molecule 25 or bi-component particle. This concept can be applied to a nano-formulated drug to determine the composition ratio of a complex drug such as a liposome or polymersome loaded with DNA, RNA, protein or small-molecule therapeutics. The greatly different responses of lipids, polymers such as PLGA, nucleic acids or proteins in the UV spectral range ensures sufficient contrast to perform the analysis. This technique has been applied to drug-loaded liposomes 26, virus-like particles containing nucleic acid payloads 27 and polymersomes with proteinaceous cargo 28.
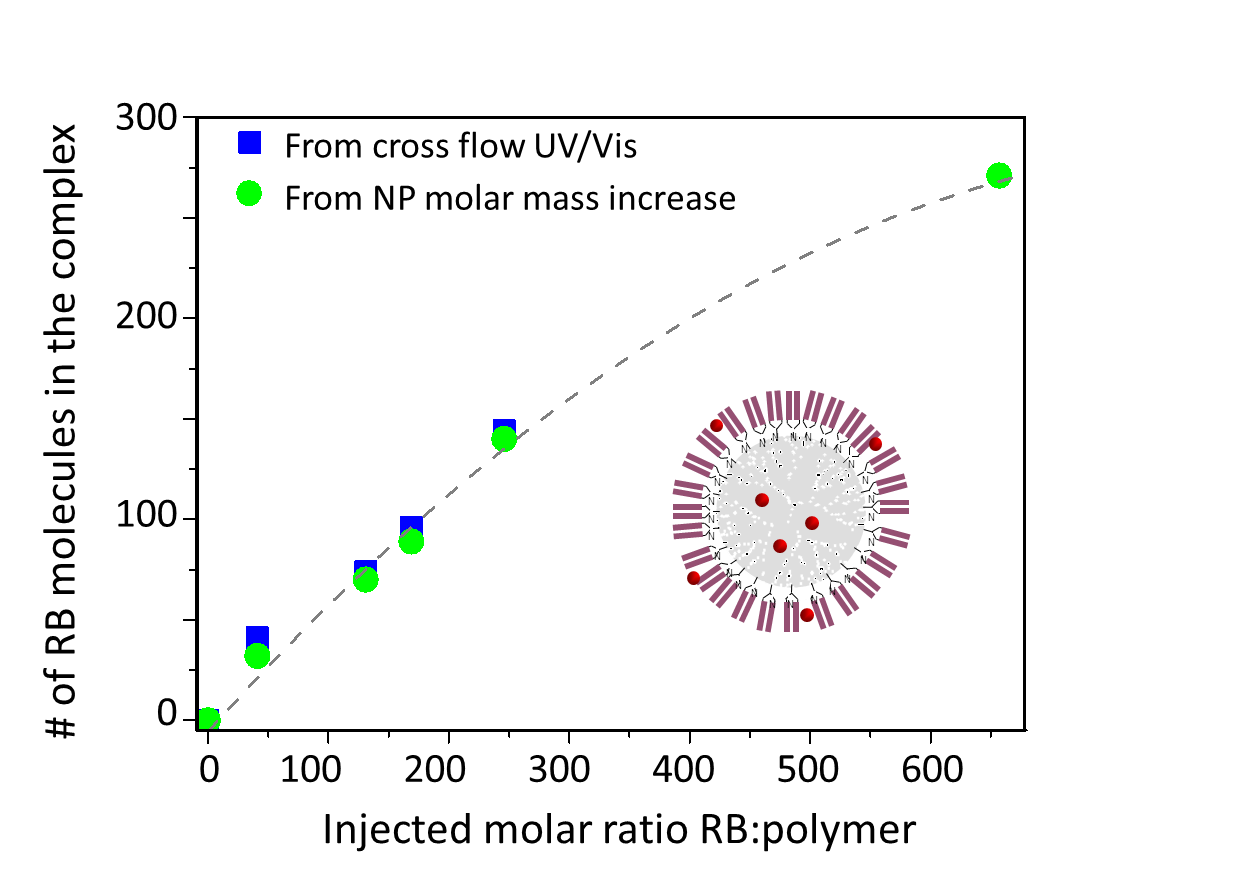
Figure 11. Comparison of two orthogonal methods to determine encapsulation efficiency of a small-molecule drug in a polymersome. Blue symbols: by quantification of free drug passing through the membrane, using a UV/Vis detector; green symbols: by analyzing the molecular weight of the drug-loaded nanoparticles relative to empty polymersomes. Reproduced with permission, Albena Lederer.
Encapsulation efficiency
Analyses of encapsulation efficiency and free:bound drug ratio are of singular importance in developing and establishing dosing guidance for a safe, effective drug nano-carrier. Free proteins or nucleic acids can be separated and quantified relative to the content of a nanoparticle carrier quite readily by FFF-MALS 28, but quantifying small molecules is more of a challenge: they will escape the
channel by passing through the membrane, but since they are often quite hydrophobic, they will also adhere to the membrane. A method introduced by Boye et al. 29 quantifies the amount of free drug in solution by means of a UV/Vis detector on the cross-flow outlet and compares to the total drug introduced in the formulation; the membrane is pre-conditioned to prevent drug adsorption by saturating it with drug substance. In addition, drug loading in the carrier can be quantified directly using the conjugate analysis. A comparison of these two orthogonal methods in Figure 11 indicates close agreement 29.
Conclusions and Outlook
The challenges posed by complex drugs, such as nano-formulations of small molecules and gene vectors, require advanced approaches to particle characterization. FFF-MALS-DLS provides solutions to many of these challenges, and is increasingly recognized as an important analytical technique for R&D in this field.
While the use of FFF with light scattering for characterization of size distributions is well-established, recent work has offered a glimpse of its potential for more advanced analyses that lie at the heart of developing and commercializing pharmaceutical nano-formulations. Further adoption of FFF-MALS-DLS in the pharmaceutical community will go hand-in-hand with advances in the instrumentation and software for increased robustness, ease-of-use and support of extended multi-detector analysis.
To learn more about the theory, technology and applications of FFF-MALS, please visit wyatt.com/FFF-MALS.
Click the button below to request information on Eclipse and DAWN instruments.
![]()
References
[1] Caputo, F., Clogston, J., Calzolai, L., Rösslein, M. & Prina-Mello, A. Measuring particle size distribution of nanoparticle enabled medicinal products, the joint view of EUNCL and NCI-NCL. A step-by-step approach combining orthogonal measurements with increasing complexity. Journal of Controlled Release vol. 299 31–43 (2019).
[2] Hu, Y., Crist, R. M. & Clogston, J. D. The utility of asymmetric flow field-flow fractionation for preclinical characterization of nanomedicines. Anal. Bioanal. Chem. (2019) doi:10.1007/s00216-019-02252-9.
[3] Gioria, S. et al. Are existing standard methods suitable for the evaluation of nanomedicines: some case studies. Nanomedicine 13, 539–554 (2018).
[4] Caputo, F. et al. Measuring Particle Size Distribution by Asymmetric Flow Field Flow Fractionation: A Powerful Method for the Preclinical Characterization of Lipid-Based Nanoparticles. Mol. Pharm. 16, 756–767 (2019).
[5] Clogston, J. D. & Hu, Y. NCL Method PCC-19: Asymmetric-Flow Field-Flow Fractionation. https://ncl.cancer.gov/sites/default/files/NCL_Method_PCC-19.pdf doi:10.17917/8S1D-BN17.
[6] Mehn, D., Caputo, F. & Roesslein, M. FFF-MALS method development and measurements of size and molecular weight Measurement of particle size distribution of protein binding, of mean molecular weight of polymeric NP components, study of batch to batch reproducibility, and study of release of f. http://www.euncl.eu/about-us/assay-cascade/PDFs/PCC/EUNCL-PCC-022.pdf?m… (2016).
[7] Giddings, J. C. A New Separation Concept Based on a Coupling of Concentration and Flow Nonuniformities. Sep. Sci. 1, 123–125 (1966).
[8] Giddings, J. Field-flow fractionation: analysis of macromolecular, colloidal, and particulate materials. Science (80-. ). 260, 1456–1465 (1993).
[9] Wahlund, K. G. & Giddings, J. C. Properties of an Asymmetrical Flow Field-Flow Fractionation Channel Having One Permeable Wall. Anal. Chem. 59, 1332–1339 (1987).
[10] Litzen, A. & Wahlund, K. G. Zone broadening and dilution in rectangular and trapezoidal asymmetrical flow field-flow fractionation channels. Anal. Chem. 63, 1001–1007 (1991).
[11] Elsenberg, S. & Johann, C. Field-Flow Fractionation: Virtual Optimization for Versatile Separation Methods | LCGC. The Column http://www.chromatographyonline.com/field-flow-fractionation-virtual-op… (2017).
[12] Johann, C., Elsenberg, S., Schuch, H. & Rösch, U. Instrument and Method to Determine the Electrophoretic Mobility of Nanoparticles and Proteins by Combining Electrical and Flow Field-Flow Fractionation. Anal. Chem. 87, 4292–4298 (2015).
[13] Wyatt, P. J. Light scattering and the absolute characterization of macromolecules. Anal. Chim. Acta 272, (1993).
[14] Van Holde, K. E. Physical biochemistry. (Prentice-Hall, 1971).
[15] Wei, Z. et al. Biophysical characterization of influenza virus subpopulations using field flow fractionation and multiangle light scattering: Correlation of particle counts, size distribution and infectivity. J. Virol. Methods 144, 122–132 (2007).
[16] Palmer, A. F., Wingert, P. & Nickels, J. Atomic force microscopy and light scattering of small unilamellar actin-containing liposomes. Biophys. J. 85, 1233–1247 (2003).
[17] Hsieh, V. H. & Wyatt, P. J. Measuring proteins with greater speed and resolution while reducing sample size. Sci. Rep. 7, 10030 (2017).
[18] Patel, B. A. et al. Multi-angle light scattering as a process analytical technology measuring real-time molecular weight for downstream process control. MAbs 10, 945–950 (2018).
[19] Tanford, C. Physical chemistry of macromolecules. (John Wiley & Sons, 1961).
[20] Tinker, D. O. Light scattering by phospholipid dispersions: Theory of light scattering by hollow spherical particles. Chem. Phys. Lipids 8, 230–257 (1972).
[21] Ortega, A. & Garcia De La Torre, J. Hydrodynamic properties of rodlike and dislike particles in dilute solution. J. Chem. Phys. 119, 9914–9919 (2003).
[22] Perrin, F. Brownian movement of an ellipsoid. II. Free rotation and depolarization of fluorescence. J. Phys. Radium 7, 1–11.
[23] Santos, N. C. & Castanho, M. A. R. B. Teaching light scattering spectroscopy: The dimension and shape of tobacco mosaic virus. Biophys. J. 71, 1641–1650 (1996).
[24] Jahn, A., Vreeland, W. N., DeVoe, D. L., Locascio, L. E. & Gaitan, M. Microfluidic directed formation of liposomes of controlled size. Langmuir 23, 6289–93 (2007).
[25] Wen, J., Arakawa, T. & Philo, J. S. Size-exclusion chromatography with on-line light-scattering, absorbance, and refractive index detectors for studying proteins and their interactions. Anal. Biochem. 240, 155–166 (1996).
[26] Hinna, A., Steiniger, F., Hupfeld, S., Brandl, M. & Kuntsche, J. Asymmetrical flow field-flow fractionation with on-line detection for drug transfer studies: A feasibility study. Anal. Bioanal. Chem. 406, 7827–7839 (2014).
[27] Citkowicz, A. et al. Characterization of virus-like particle assembly for DNA delivery using asymmetrical flow field-flow fractionation and light scattering. Anal. Biochem. 376, 163–172 (2008).
[28] Gräfe, D., Gaitzsch, J., Appelhans, D. & Voit, B. Cross-linked polymersomes as nanoreactors for controlled and stabilized single and cascade enzymatic reactions. Nanoscale 6, 10752–10761 (2014).
[29] Boye, S., Polikarpov, N., Appelhans, D. & Lederer, A. An alternative route to dye-polymer complexation study using asymmetrical flow field-flow fractionation. J. Chromatogr. A 1217, 4841–9 (2010).