Hydrodynamics of Intravitreal Injections into Liquid Vitreous Substitutes
* Correspondence: y.bouremel@ucl.ac.uk; Tel.: +4420 7608 6969
Introduction
Intravitreal therapy (IVT) is one of the most frequently performed procedures across all medical and surgical specialities [1, 2]. Since the advent of the first intravitreal anti-vascular endothelial growth factor (VEGF) to treat age-related macular degeneration (AMD), the use of intravitreal injections has increased dramatically. In older eyes, liquefaction of the vitreous (synchysis) occurs due to the dissociation of collagen and hyaluronan, particularly in the central area, where there is lower collagen content [3]. Vitreous liquefaction causes some loss of viscoelastic behaviour [4, 5]. Understanding the viscosity of the vitreous and vitreous substitutes is essential in predicting the dispersion of IVT within the vitreous cavity [6].
Diffusion is generally understood as the principal mechanism of drug delivery in IVT. Eye movements may produce effective fluid mixing within a liquefied vitreous [7-9]. The prediction of drug distribution within the eye to avoid tissue toxicity and to determine the precise drug levels in target tissues has been a subject of modelling studies. Computational methods have been described to model drug transport following intravitreal injection from a point source [9-13]. Other models have been developed to simulate drug distribution by an intraocular or periocular implant [12, 14, 15]. Early models primarily considered diffusion, while more recent models consider both diffusion and convection produced by the aqueous humour flow. There has been limited consideration during preclinical studies on what the impact on dosing would be in patients with vitrectomised eyes. The impact of hydrodynamic forces of intravitreal solutions when injected into vitreous or vitreous substitutes has not been well described.
We investigated the hydrodynamic effects of simulated liquid vitreous and vitreous substitutes such as dynamic viscosity, surface tension, and volumetric density on the distribution profile of the initial bolus administered in IVT using a 3D-printed model [16]. We also examine clinically relevant injection rates and the depth of needle placement. These experimental data may inform preclinical computational modelling of IVT mixing, IVT formulation optimisation, and excipient design. Where computational models do exist, they tend to underestimate the starting surface area of an injected bolus of a drug.
Experimental Approach and Results
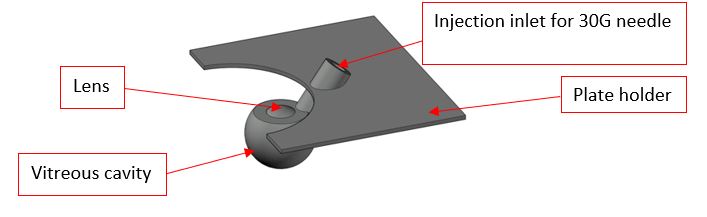
A 3D-printed model of the vitreous cavity scaled to the average geometry of the adult human eye was used (Figure 1). The model was fabricated from a clear resin to visualise dye dispersion within the cavity after injection. The 3D-printed model featured an injection inlet to accommodate a 30G needle and to standardise needle tip depth within the vitreous cavity. The needle shaft was inserted into the 3D-vitreous cavity.
Coomassie blue dye (50 μL) in distilled water was injected at slow and fast injection rates via a bevelled stainless-steel needle (30G). The recording started with the injection and stopped shortly after the end of injection when the dye bolus was motionless. Images were recorded using a digital SLR camera (Canon EOS 7D) mounted with a 60 mm lens at 25 Hz for a maximum of 5 s minimising any bolus diffusion within the vitreous cavity. Images were processed using MATLAB software (R2017b, The MathWorks, Inc., Natick, MA, USA) to visualise only the dye tracer. Higher dye concentration correlated to higher dye intensity. This was used to quantify the dispersion dynamics of the injected dye in terms of bolus surface area. Sodium hyaluronate (HA, 1.0, 2.0 and 3.0 mg/mL) and silicone oil (S500 and S1000) were used as vitreous substitutes. Table 1 shows their recorded viscosity and interfacial tension at air/liquid .
Table 1. Summary of viscosity and interfacial surface tension measurements of vitreous substitutes.
|
Vitreous Substitute |
Viscosity (Pa.s) |
Surface Tension (Liquid/Air) (mN/m) |
|
Distilled water (control) |
0.0010 ± 0.0001 |
72.8 ± 0.1 |
|
Sodium hyaluronate (HA) |
|
|
|
1.0 mg/mL |
0.30 ± 0.02 |
71.0 ± 4.0 |
|
2.0 mg/mL |
0.48 ± 0.07 |
75.2 ± 1.3 |
|
3.0 mg/mL |
1.14 ± 0.03 |
78.5 ± 1.9 |
|
Silicone oil (SO) |
|
|
|
S500 |
0.50 ± 0.05 |
26.7 ± 0.7 |
|
S1000 |
1.09 ± 0.01 |
35.7 ± 1.5 |
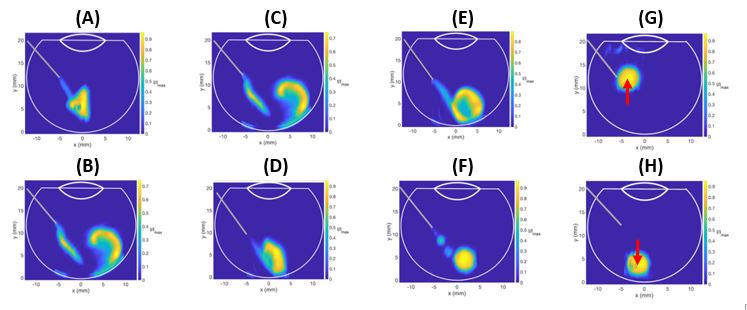
Figure 2 shows the impact on the intravitreal injection dynamics when considering injection rate (A-B) as well as the vitreous substitute viscosity (C-D), interfacial tension (E-F) and density (G-H). When comparing slow injection rate (Fig 2A) to fast injection rate (Fig 2B) into 1.0 mg/ml HA, we observed that the Dye area was larger with faster injections rates (Figure 2B). The bolus impacted the posterior wall of the model resulting in the engulfment of the dye (Figure 2B).
The viscosity of the vitreous substitute was increased by altering the concentration of HA from 1.0 mg/mL (Figure 2C) to 3.0 mg/mL (Figure 2D). The engulfment area of the dye bolus diminished with higher viscosity; resulting in a reduction of mixing as there was a smaller surface area available for diffusion. This is due to the effect of viscosity dissipating kinetic energy into heat, slowing down the dye velocity in the vitreous substitute, and reducing the size of engulfment.
The increase of the interfacial tensions between the vitreous substitute and the injected bolus influences the distribution dynamics of the dye. When comparing the injection into 2.0 mg/mL HA (Figure 2E) versus S500 (Figure 2F), the interfacial tension prevented the injected liquid from stretching. The extra fluid momentum broke down the stream of the injected bolus, producing satellite droplets, thereby reducing the surface area of the injected liquid.
Finally, the density of the vitreous substitute plays an important role in bolus buoyancy. A fluid with a lower volumetric density than the vitreous substitute into which it is injected tends to rise (Figure 2G). S1000 was 9% heavier than the injected dye. Inversely, injected fluids with higher volumetric density than S500 (3% lighter than the bolus solution, Figure 2H) sunk to the bottom of the vitreous cavity.
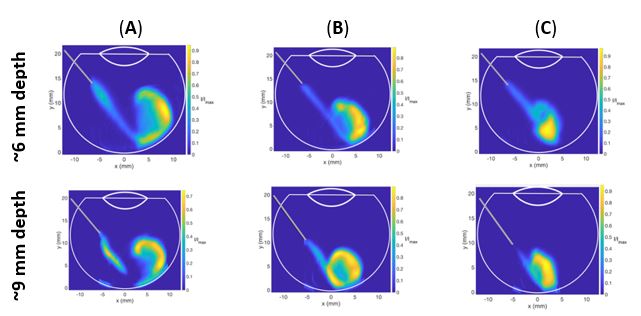
Experiments were conducted with different needle length depths (approximately 6 vs 9 mm, Figure 3) to evaluate the impact this would have on the distribution of dye when injected into different concentrations of HA. Injections at shallower needle depths demonstrated larger dye areas for all HA concentrations as compared to deeper needle placement. Due to the length of the needle within the vitreous cavity being shorter when the needle is not fully inserted, the dye reached the posterior aspect of the cavity with a lower velocity, hence, reducing the amount of engulfment for all HA concentrations. For a high viscosity such as 3.0mg/mL HA, the dye did not reach the back of the eye, indicating that short needle placement may prevent the bolus from reaching the retina in a static vitreous cavity. Deeper needle placement may, therefore, be preferable for delivering IVT, to ensure that the drug reaches the retina, especially if the vitreous or vitreous substitute has a slightly higher viscosity.
Conclusion
Our study highlights critical parameters and physical characteristics, which should be considered when designing or creating a vitreous substitute. Improved quantitative proteomic analyses of the vitreous through mass spectrometry-based methods have helped identify future therapeutic targets or agents to be added to vitreous substitutes. However, viscosity, volumetric density, and interfacial surface tension of the vitreous substitutes should also be considered. Properties influencing the convection of the bolus during the intravitreal injection, and the subsequent diffusion of injected agents into vitreous substitutes should be simulated at a preclinical stage of development.
For the full article, please see "Hydrodynamics of intravitreal injections into liquid vitreous substitutes". Pharmaceutics 2019, 11(8), 371; https://doi.org/10.3390/pharmaceutics11080371
Acknowledgements
The authors acknowledge the support of the UK National Institute for Health Research Biomedical Research Centre at Moorfields Eye Hospital and the UCL Institute of Ophthalmology, the Helen Hamlyn Trust in memory of Paul Hamlyn, The Michael and Ilse Katz Foundation and Moorfields Eye Charity.
References
1. Lau, P.E.T., K.S. Jenkins, and C.J. Layton, Current Evidence for the Prevention of Endophthalmitis in Anti-VEGF Intravitreal Injections. Journal of Ophthalmology, 2018.
2. Lamminsalo, M., et al., Extended Pharmacokinetic Model of the Rabbit Eye for Intravitreal and Intracameral Injections of Macromolecules: Quantitative Analysis of Anterior and Posterior Elimination Pathways. Pharmaceutical Research, 2018. 35(8).
3. Sebag, J., Aging of the Vitreous. Eye-Transactions of the Ophthalmological Societies of the United Kingdom, 1987. 1: p. 254-262.
4. Le Goff, M.M. and P.N. Bishop, Adult vitreous structure and postnatal changes. Eye, 2008. 22(10): p. 1214-1222.
5. Bishop, P.N., Structural macromolecules and supramolecular organisation of the vitreous gel. Progress in Retinal and Eye Research, 2000. 19(3): p. 323-344.
6. Awwad, S., et al., The PK-Eye: A Novel In Vitro Ocular Flow Model for Use in Preclinical Drug Development. Journal of Pharmaceutical Sciences, 2015. 104(10): p. 3330-3342.
7. Stein, S., et al., Distribution of fluorescein sodium and triamcinolone acetonide in the simulated liquefied and vitrectomized Vitreous Model with simulated eye movements. European Journal of Pharmaceutical Sciences, 2017. 109: p. 233-243.
8. del Amo, E.M. and A. Urtti, Rabbit as an animal model for intravitreal pharmacokinetics: Clinical predictability and quality of the published data. Experimental Eye Research, 2015. 137: p. 111-124.
9. Friedrich, S., B. Saville, and Y.L. Cheng, Drug distribution in the vitreous humor of the human eye: The effects of aphakia and changes in retinal permeability and vitreous diffusivity. Journal of Ocular Pharmacology and Therapeutics, 1997. 13(5): p. 445-459.
10. Missel, P.J., Simulating Intravitreal Injections in Anatomically Accurate Models for Rabbit, Monkey, and Human Eyes. Pharmaceutical Research, 2012. 29(12): p. 3251-3272.
11. Park, J., et al., Evaluation of coupled convective-diffusive transport of drugs administered by intravitreal injection and controlled release implant. Journal of Controlled Release, 2005. 105(3): p. 279-295.
12. Kathawate, J. and S. Acharya, Computational modeling of intravitreal drug delivery in the vitreous chamber with different vitreous substitutes. International Journal of Heat and Mass Transfer, 2008. 51(23-24): p. 5598-5609.
13. Zhang, Y., et al., Three-Dimensional Transport Model for Intravitreal and Suprachoroidal Drug Injection. Investigative Ophthalmology & Visual Science, 2018. 59(12): p. 5266-5276.
14. Stay, M.S., et al., Computer simulation of convective and diffusive transport of controlled-release drugs in the vitreous humor. Pharmaceutical Research, 2003. 20(1): p. 96-102.
15. Kim, H., et al., Study of ocular transport of drugs released from an intravitreal implant using magnetic resonance imaging. Annals of Biomedical Engineering, 2005. 33(2): p. 150-164.
16. Henein, C., Awwad, S., Ibeanu, N.,Vlatakis, S., Brocchini, S., Khaw, P.T., Bouremel, Y., Hydrodynamics of Intravitreal Injections into Liquid Vitreous Substitutes. Pharmaceutics, 2019. 11(8): p. 371.