Drug unloading measurement of APIs on a particle-by-particle basis
Introduction
Nanocarriers can help to extend drug release, can be functionalised to target specific organs or tumours, and can be used to release active pharmaceutical ingredients (API’s) ‘on-demand’ using physical or chemical triggers. This exciting approach to medicine is, however, hindered by the lack of accurate characterisation techniques for drug loaded nanocarriers, including drug release studies.
Measurement of the drug loaded into or onto a nanoparticle has been a long-standing issue in the field of nanomedicine. Researchers in this field have used different techniques, such as HPLC or UV-Vis, to measure such parameters, however, none have gained wide-spread trust within the community. Accurate nanoparticle characterisation for targeted drug release development can be expensive, slow, inaccurate and unreliable.
In this article, we will demonstrate drug release measurements of mesoporous silica nanoparticles loaded with cetylpyridinium chloride (CPC), a quaternary cationic ammonium compound, which is an active pharmaceutical ingredient in lozenges, nasal sprays, mouthwash and a variety of other products due to its antiseptic properties. Oxford HighQ has developed an instrument that allows rapid and consistent measurement of drug-loaded particle populations (both surface coated or internally loaded) for targeted drug delivery through particle-by-particle measurements of refractive index, providing a resolution of a few percent for particles from about 50nm to 500nm in size.
Experimental methods
Mesoporous silica nanoparticles of approximatively 280 nm diameter (unpublished results) were loaded with CPC through a method devised by Professor Zoe Pikramenou’s group. In order to fully suspend the particles, they were dispersed in a dilute aqueous solvent and sonicated. Solutions were made up at a concentration of 0.3 mg/mL which led to a mean count rate of 17 events per minute. Mesoporous silica was loaded with CPC at a concentration of 2.33 mg for 1 mg of silica.
Continuous measurements were taken using Oxford HighQ’s nanoparticle analyser over the course of a three-hour period during which 3,000 events were recorded. The results were obtained using Oxford HighQ’s instrument shown in Figure 1 a), and were complemented by UV-VIS spectroscopy which confirmed the drug loading (unpublished results).
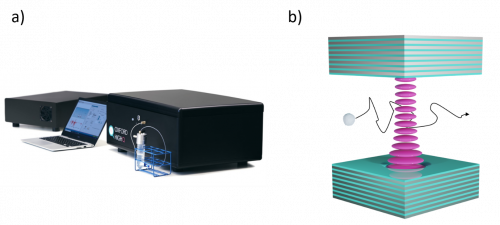
Figure 1: :a) Nanoparticle analyser from Oxford HighQ - b) Schematic of a microcavity with a nanoparticle flowing through the optical mode
Oxford HighQ’s instrument measures nanoparticle drug load through the particles polarisability1, i.e. the response of nanoparticles to an electromagnetic excitation and an effective measurement of their refractive index. Figure 1 b) shows the basic principle of the technique. The nanoparticles diffuse through a microcavity optical mode2. The polarisability of a nanoparticle is then inferred from the disruption of the transmitted laser beam. The polarisability of a nanoparticle can be calculated using its volume V and refractive index n such as:
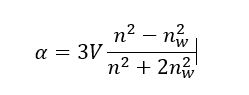
where nw is the solvent’s refractive index, which was water in this case. For a complex nanoparticle made of two materials, say a host material such as silica and a drug, the overall polarisability is simply the sum of its components.
Using Oxford HighQ’s instrument, you can therefore measure minute changes in composition caused by drug off-loading over time as it will result in a quantifiable decrease of the polarisability.
Knowing the refractive index of the drug, the density of the host material and the nanoparticle diameter, we can then quantify the volume of drug released per nanoparticle as well as the volume of silica. The drug loading content in mass can be computed using the equation:
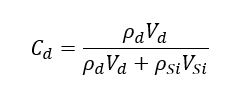
where ρSi/ρd is the density of the silica/drug.
Results and discussion
Figure 2 shows the distribution of drug loading content, i.e. the drug to nanoparticle mass ratio, at different points in time during the offloading process.
The histogram of measurements at 10 minutes shows a broad range of loaded nanoparticles, which are characterised by events situated between 100 and 600 µg/mg. This loaded population slowly disappears over time, with most of the bins disappearing within the first 40 minutes. This result is consistent with the expected time of release (unpublished results). The top panel of Figure 2 corresponds to the distribution of the same nanoparticles prior to loading. This distribution centered around 0 µg/mg with a finite spread originates from the polydispersity of the nanoparticles rather than any residual loading.
Using a time series, one can measure the mean drug offloading as a function of time. Figure 3 shows the mean API drug loading for the population of nanoparticles over time using a rolling average window of 350 seconds. A steady decrease followed by a sharp release is observed. After 40 minutes, the CPC payload has been released and we see a consistent flat trend with no further decreases.
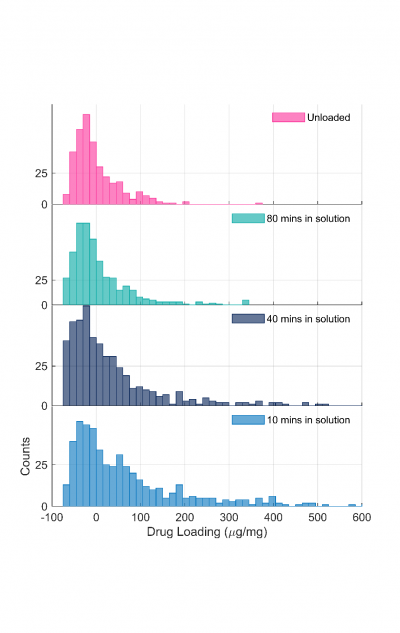
Figure 2: Drug loading distribution in µg/mg taken at different time points during a continuous experiment.
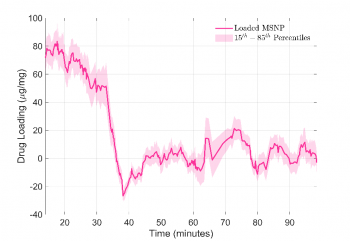
Figure 3: Line graph showing decrease in drug loading (in µg/mg) over time, with a steady decrease from time 0 until 40 minutes. Shadowed regions represent 15th to 85th percentile confidence intervals.
Oxford HighQ’s instrument can measure a distribution of drug loading on a particle-by-particle basis over time. In the present case, the nanoparticle population transfers between loaded to unloaded particles can be determined by differentiating between the histograms from Figure 2 at 10 minutes and 80 minutes. Figure 4 shows the results of this procedure and gives the percentage of nanoparticle population transferred from a given drug loading to the unloaded state. A clear trend has been observed, showing reducing percentages of nanoparticles with increasing cargos. Summing over the loaded range, we find that 25% of the nanoparticle population offloads during the course of the measurement.
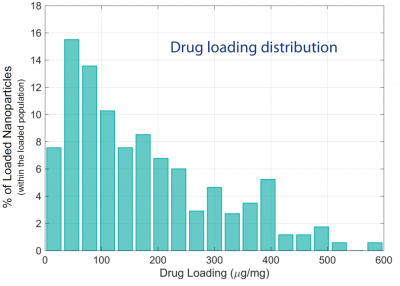
Figure 4: Population transferred before and after offloading of CPC as a function of drug loading.
Conclusion
In this article, we have demonstrated the measurement of a drug offloading profile on a complex system such as mesoporous silica nanoparticles loaded with CPC. The insight given by a particle-by-particle measurement exceeds what can be achieved using conventional techniques such as UV-Vis, especially as all measurements are done with no user interaction while the particles are offloading.
The technique can be adapted to any host material, buffer solution, or drug, and can be expanded to any complex engineered nanoparticle for nanomedicine applications and beyond.
In the future, this technique will be applied to other drug loaded nanoparticles such as liposomes, core-shell nanoparticles, polymeric particles and viral-vectors.
References
1Nanoparticle trapping and characterization using open microcavities, Nano Lett. 16, 1672 (2016)
2Open-access microcavities for chemical sensing, Nanotechnology 27, 74003 (2016)